Dutch vs British Child Poverty Under the Age of 16
COMPARE
Dutch
British
Child Poverty Under the Age of 16
Child Poverty Under the Age of 16 Comparison
Dutch
British
14.8%
CHILD POVERTY UNDER THE AGE OF 16
95.1/ 100
METRIC RATING
100th/ 347
METRIC RANK
14.7%
CHILD POVERTY UNDER THE AGE OF 16
95.5/ 100
METRIC RATING
99th/ 347
METRIC RANK
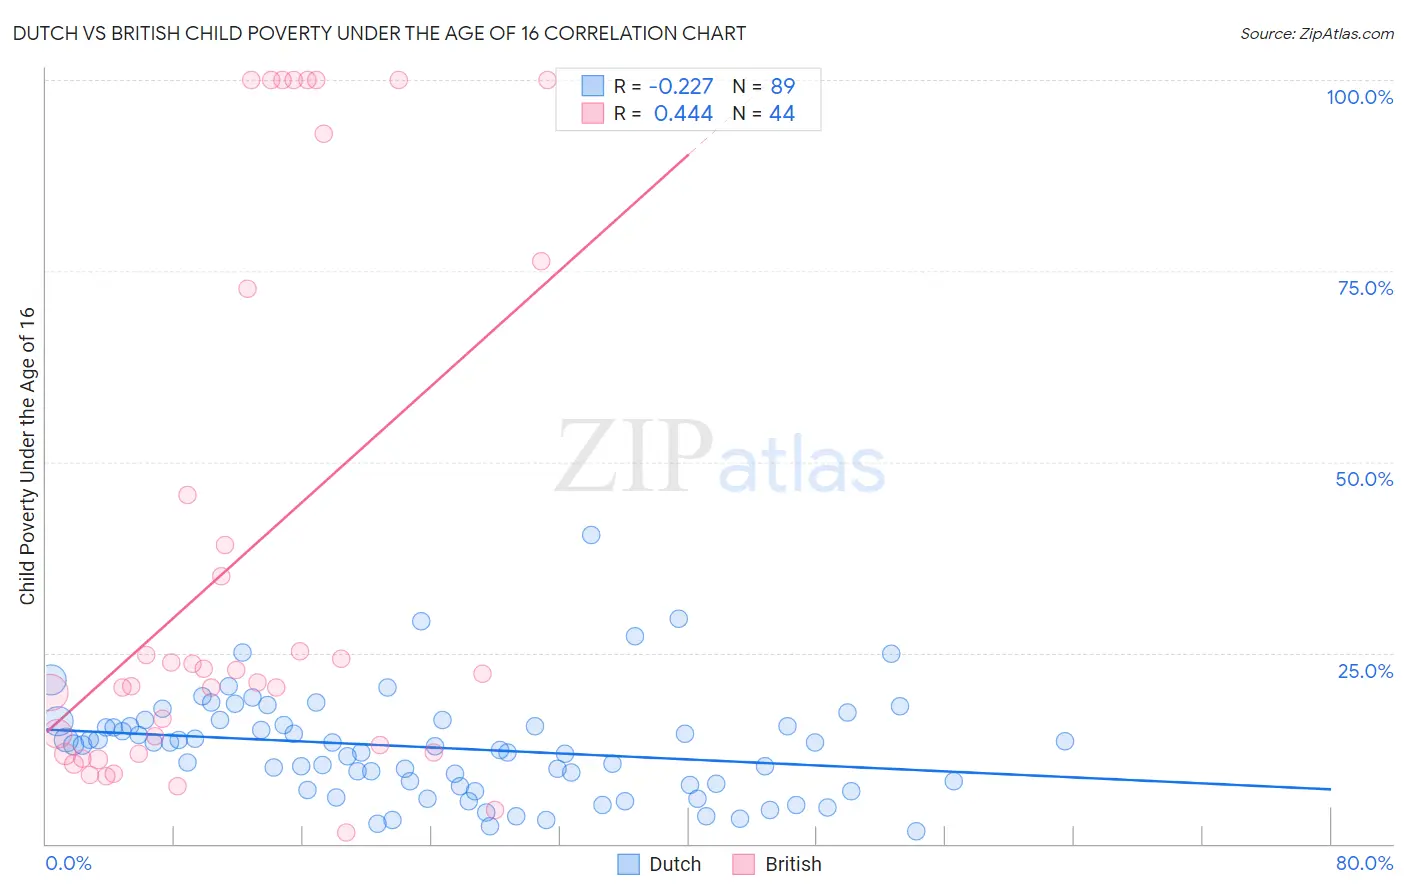
Dutch vs British Child Poverty Under the Age of 16 Correlation Chart
The statistical analysis conducted on geographies consisting of 542,951,177 people shows a weak negative correlation between the proportion of Dutch and poverty level among children under the age of 16 in the United States with a correlation coefficient (R) of -0.227 and weighted average of 14.8%. Similarly, the statistical analysis conducted on geographies consisting of 522,379,020 people shows a moderate positive correlation between the proportion of British and poverty level among children under the age of 16 in the United States with a correlation coefficient (R) of 0.444 and weighted average of 14.7%, a difference of 0.31%.
Child Poverty Under the Age of 16 Correlation Summary
| Measurement | Dutch | British |
| Minimum | 1.7% | 1.4% |
| Maximum | 40.4% | 100.0% |
| Range | 38.7% | 98.6% |
| Mean | 12.6% | 37.3% |
| Median | 13.0% | 21.7% |
| Interquartile 25% (IQ1) | 7.6% | 11.9% |
| Interquartile 75% (IQ3) | 15.9% | 59.2% |
| Interquartile Range (IQR) | 8.3% | 47.3% |
| Standard Deviation (Sample) | 6.8% | 34.9% |
| Standard Deviation (Population) | 6.8% | 34.5% |
Demographics Similar to Dutch and British by Child Poverty Under the Age of 16
In terms of child poverty under the age of 16, the demographic groups most similar to Dutch are Immigrants from Switzerland (14.8%, a difference of 0.010%), Romanian (14.8%, a difference of 0.080%), Immigrants from Egypt (14.8%, a difference of 0.13%), Immigrants from England (14.8%, a difference of 0.17%), and Basque (14.8%, a difference of 0.28%). Similarly, the demographic groups most similar to British are Immigrants from Belarus (14.7%, a difference of 0.12%), Paraguayan (14.7%, a difference of 0.13%), Immigrants from France (14.7%, a difference of 0.25%), Immigrants from Switzerland (14.8%, a difference of 0.33%), and Romanian (14.8%, a difference of 0.40%).
| Demographics | Rating | Rank | Child Poverty Under the Age of 16 |
| Germans | 96.9 /100 | #89 | Exceptional 14.5% |
| Austrians | 96.9 /100 | #90 | Exceptional 14.5% |
| Immigrants | North America | 96.7 /100 | #91 | Exceptional 14.6% |
| Immigrants | Italy | 96.7 /100 | #92 | Exceptional 14.6% |
| Argentineans | 96.6 /100 | #93 | Exceptional 14.6% |
| Immigrants | South Africa | 96.3 /100 | #94 | Exceptional 14.6% |
| Immigrants | Croatia | 96.1 /100 | #95 | Exceptional 14.6% |
| Immigrants | France | 95.8 /100 | #96 | Exceptional 14.7% |
| Paraguayans | 95.7 /100 | #97 | Exceptional 14.7% |
| Immigrants | Belarus | 95.7 /100 | #98 | Exceptional 14.7% |
| British | 95.5 /100 | #99 | Exceptional 14.7% |
| Dutch | 95.1 /100 | #100 | Exceptional 14.8% |
| Immigrants | Switzerland | 95.1 /100 | #101 | Exceptional 14.8% |
| Romanians | 95.0 /100 | #102 | Exceptional 14.8% |
| Immigrants | Egypt | 94.9 /100 | #103 | Exceptional 14.8% |
| Immigrants | England | 94.8 /100 | #104 | Exceptional 14.8% |
| Basques | 94.7 /100 | #105 | Exceptional 14.8% |
| Serbians | 94.5 /100 | #106 | Exceptional 14.8% |
| Chileans | 94.4 /100 | #107 | Exceptional 14.8% |
| Jordanians | 94.2 /100 | #108 | Exceptional 14.8% |
| Tlingit-Haida | 94.1 /100 | #109 | Exceptional 14.9% |