Delaware vs Immigrants from Argentina Disability
COMPARE
Delaware
Immigrants from Argentina
Disability
Disability Comparison
Delaware
Immigrants from Argentina
13.6%
DISABILITY
0.0/ 100
METRIC RATING
311th/ 347
METRIC RANK
10.6%
DISABILITY
100.0/ 100
METRIC RATING
29th/ 347
METRIC RANK
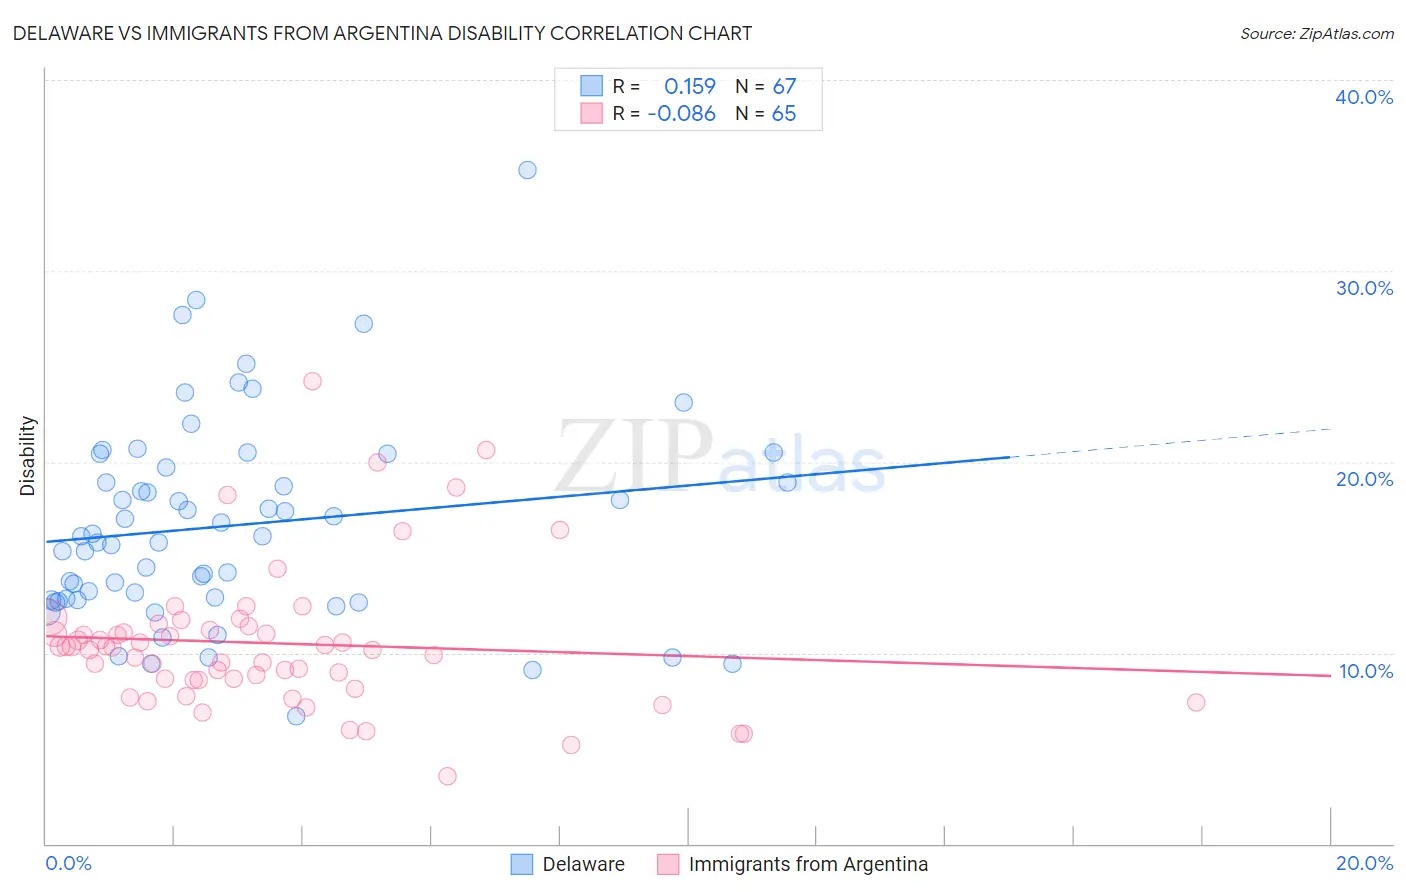
Delaware vs Immigrants from Argentina Disability Correlation Chart
The statistical analysis conducted on geographies consisting of 96,240,981 people shows a poor positive correlation between the proportion of Delaware and percentage of population with a disability in the United States with a correlation coefficient (R) of 0.159 and weighted average of 13.6%. Similarly, the statistical analysis conducted on geographies consisting of 264,433,054 people shows a slight negative correlation between the proportion of Immigrants from Argentina and percentage of population with a disability in the United States with a correlation coefficient (R) of -0.086 and weighted average of 10.6%, a difference of 28.3%.
Disability Correlation Summary
| Measurement | Delaware | Immigrants from Argentina |
| Minimum | 6.7% | 3.5% |
| Maximum | 35.3% | 24.2% |
| Range | 28.6% | 20.7% |
| Mean | 16.7% | 10.5% |
| Median | 16.1% | 10.3% |
| Interquartile 25% (IQ1) | 12.8% | 8.5% |
| Interquartile 75% (IQ3) | 19.7% | 11.3% |
| Interquartile Range (IQR) | 6.9% | 2.7% |
| Standard Deviation (Sample) | 5.3% | 3.7% |
| Standard Deviation (Population) | 5.3% | 3.7% |
Similar Demographics by Disability
Demographics Similar to Delaware by Disability
In terms of disability, the demographic groups most similar to Delaware are Blackfeet (13.6%, a difference of 0.040%), Spanish American (13.6%, a difference of 0.24%), Tlingit-Haida (13.5%, a difference of 0.56%), Cree (13.7%, a difference of 0.59%), and Black/African American (13.7%, a difference of 0.63%).
| Demographics | Rating | Rank | Disability |
| Yakama | 0.0 /100 | #304 | Tragic 13.4% |
| French Canadians | 0.0 /100 | #305 | Tragic 13.4% |
| Cape Verdeans | 0.0 /100 | #306 | Tragic 13.5% |
| Shoshone | 0.0 /100 | #307 | Tragic 13.5% |
| French American Indians | 0.0 /100 | #308 | Tragic 13.5% |
| Tlingit-Haida | 0.0 /100 | #309 | Tragic 13.5% |
| Blackfeet | 0.0 /100 | #310 | Tragic 13.6% |
| Delaware | 0.0 /100 | #311 | Tragic 13.6% |
| Spanish Americans | 0.0 /100 | #312 | Tragic 13.6% |
| Cree | 0.0 /100 | #313 | Tragic 13.7% |
| Blacks/African Americans | 0.0 /100 | #314 | Tragic 13.7% |
| Puget Sound Salish | 0.0 /100 | #315 | Tragic 13.7% |
| Pima | 0.0 /100 | #316 | Tragic 13.7% |
| Immigrants | Cabo Verde | 0.0 /100 | #317 | Tragic 13.7% |
| Menominee | 0.0 /100 | #318 | Tragic 13.8% |
Demographics Similar to Immigrants from Argentina by Disability
In terms of disability, the demographic groups most similar to Immigrants from Argentina are Egyptian (10.6%, a difference of 0.13%), Immigrants from Turkey (10.6%, a difference of 0.15%), Immigrants from Egypt (10.6%, a difference of 0.23%), Cypriot (10.6%, a difference of 0.26%), and Argentinean (10.6%, a difference of 0.27%).
| Demographics | Rating | Rank | Disability |
| Immigrants | Sri Lanka | 100.0 /100 | #22 | Exceptional 10.5% |
| Immigrants | Asia | 100.0 /100 | #23 | Exceptional 10.5% |
| Venezuelans | 100.0 /100 | #24 | Exceptional 10.5% |
| Immigrants | Malaysia | 100.0 /100 | #25 | Exceptional 10.6% |
| Argentineans | 100.0 /100 | #26 | Exceptional 10.6% |
| Cypriots | 100.0 /100 | #27 | Exceptional 10.6% |
| Egyptians | 100.0 /100 | #28 | Exceptional 10.6% |
| Immigrants | Argentina | 100.0 /100 | #29 | Exceptional 10.6% |
| Immigrants | Turkey | 100.0 /100 | #30 | Exceptional 10.6% |
| Immigrants | Egypt | 100.0 /100 | #31 | Exceptional 10.6% |
| Paraguayans | 100.0 /100 | #32 | Exceptional 10.6% |
| Immigrants | Kuwait | 100.0 /100 | #33 | Exceptional 10.7% |
| Immigrants | Ethiopia | 100.0 /100 | #34 | Exceptional 10.7% |
| Immigrants | Indonesia | 100.0 /100 | #35 | Exceptional 10.7% |
| Ethiopians | 100.0 /100 | #36 | Exceptional 10.7% |