Immigrants from Northern Africa vs Senegalese Male Disability
COMPARE
Immigrants from Northern Africa
Senegalese
Male Disability
Male Disability Comparison
Immigrants from Northern Africa
Senegalese
10.4%
MALE DISABILITY
99.4/ 100
METRIC RATING
61st/ 347
METRIC RANK
11.4%
MALE DISABILITY
23.2/ 100
METRIC RATING
191st/ 347
METRIC RANK
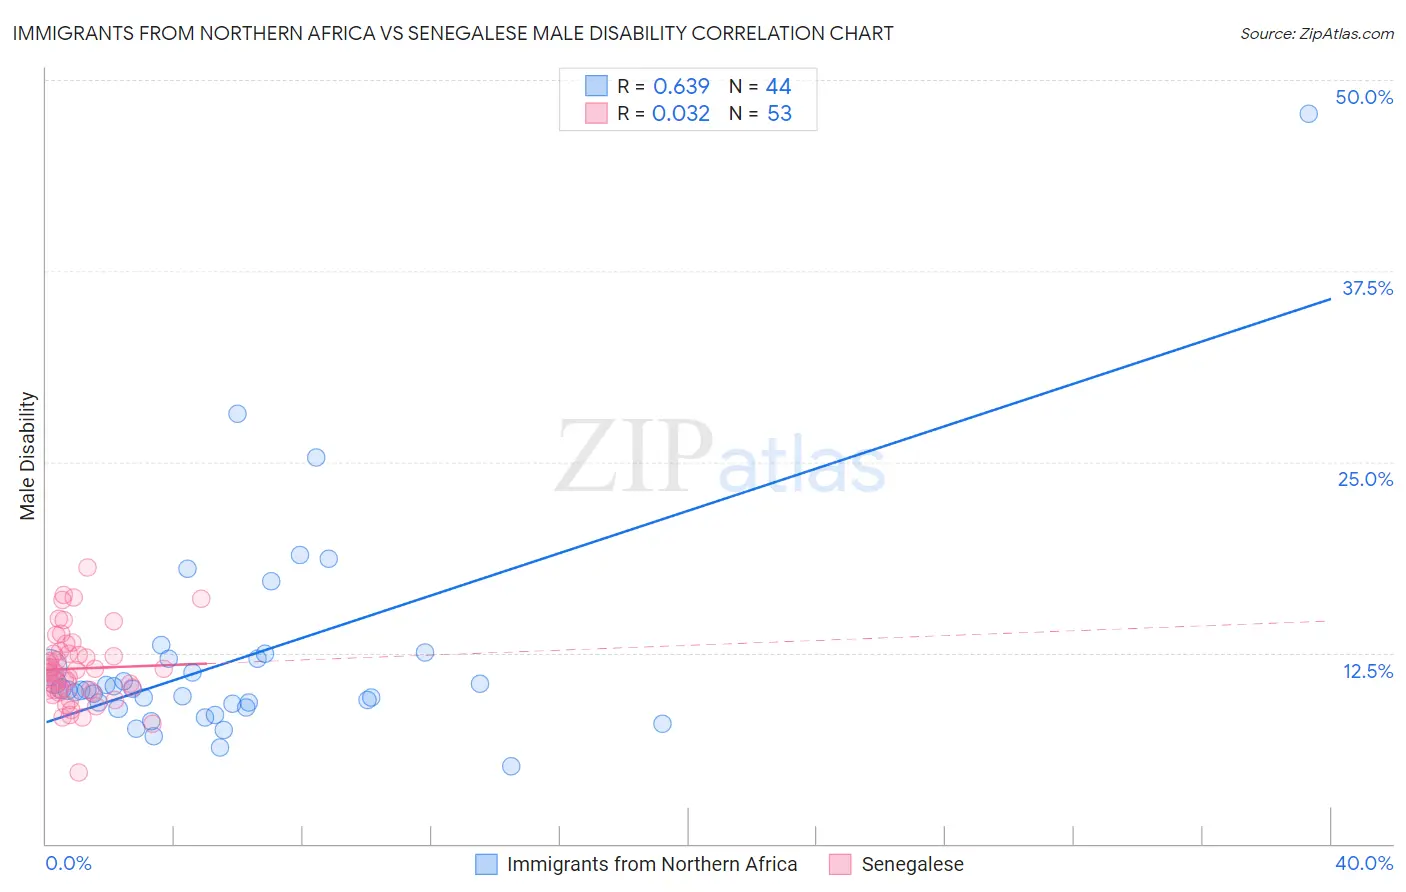
Immigrants from Northern Africa vs Senegalese Male Disability Correlation Chart
The statistical analysis conducted on geographies consisting of 321,185,016 people shows a significant positive correlation between the proportion of Immigrants from Northern Africa and percentage of males with a disability in the United States with a correlation coefficient (R) of 0.639 and weighted average of 10.4%. Similarly, the statistical analysis conducted on geographies consisting of 78,137,196 people shows no correlation between the proportion of Senegalese and percentage of males with a disability in the United States with a correlation coefficient (R) of 0.032 and weighted average of 11.4%, a difference of 9.5%.
Male Disability Correlation Summary
| Measurement | Immigrants from Northern Africa | Senegalese |
| Minimum | 5.1% | 4.6% |
| Maximum | 47.8% | 18.0% |
| Range | 42.7% | 13.4% |
| Mean | 12.1% | 11.5% |
| Median | 10.0% | 11.2% |
| Interquartile 25% (IQ1) | 9.0% | 10.0% |
| Interquartile 75% (IQ3) | 12.1% | 12.5% |
| Interquartile Range (IQR) | 3.1% | 2.5% |
| Standard Deviation (Sample) | 7.1% | 2.5% |
| Standard Deviation (Population) | 7.1% | 2.5% |
Similar Demographics by Male Disability
Demographics Similar to Immigrants from Northern Africa by Male Disability
In terms of male disability, the demographic groups most similar to Immigrants from Northern Africa are Immigrants from Colombia (10.4%, a difference of 0.090%), Immigrants from Australia (10.4%, a difference of 0.15%), Immigrants from Ecuador (10.4%, a difference of 0.26%), Immigrants from Belarus (10.4%, a difference of 0.29%), and Immigrants from Japan (10.4%, a difference of 0.30%).
| Demographics | Rating | Rank | Male Disability |
| Peruvians | 99.6 /100 | #54 | Exceptional 10.4% |
| Immigrants | Eritrea | 99.6 /100 | #55 | Exceptional 10.4% |
| Tongans | 99.6 /100 | #56 | Exceptional 10.4% |
| Immigrants | South America | 99.6 /100 | #57 | Exceptional 10.4% |
| Immigrants | Japan | 99.5 /100 | #58 | Exceptional 10.4% |
| Immigrants | Australia | 99.5 /100 | #59 | Exceptional 10.4% |
| Immigrants | Colombia | 99.5 /100 | #60 | Exceptional 10.4% |
| Immigrants | Northern Africa | 99.4 /100 | #61 | Exceptional 10.4% |
| Immigrants | Ecuador | 99.3 /100 | #62 | Exceptional 10.4% |
| Immigrants | Belarus | 99.3 /100 | #63 | Exceptional 10.4% |
| Jordanians | 99.3 /100 | #64 | Exceptional 10.5% |
| Immigrants | Grenada | 99.2 /100 | #65 | Exceptional 10.5% |
| Guyanese | 99.2 /100 | #66 | Exceptional 10.5% |
| Immigrants | Afghanistan | 99.2 /100 | #67 | Exceptional 10.5% |
| Colombians | 99.2 /100 | #68 | Exceptional 10.5% |
Demographics Similar to Senegalese by Male Disability
In terms of male disability, the demographic groups most similar to Senegalese are Assyrian/Chaldean/Syriac (11.4%, a difference of 0.0%), Greek (11.4%, a difference of 0.080%), Immigrants from Bosnia and Herzegovina (11.4%, a difference of 0.16%), Belizean (11.4%, a difference of 0.16%), and Immigrants from Oceania (11.4%, a difference of 0.19%).
| Demographics | Rating | Rank | Male Disability |
| Iraqis | 30.5 /100 | #184 | Fair 11.3% |
| Pakistanis | 30.3 /100 | #185 | Fair 11.3% |
| Immigrants | Zaire | 27.6 /100 | #186 | Fair 11.4% |
| Immigrants | Austria | 27.3 /100 | #187 | Fair 11.4% |
| Estonians | 26.8 /100 | #188 | Fair 11.4% |
| Immigrants | Netherlands | 25.9 /100 | #189 | Fair 11.4% |
| Immigrants | Bosnia and Herzegovina | 25.4 /100 | #190 | Fair 11.4% |
| Senegalese | 23.2 /100 | #191 | Fair 11.4% |
| Assyrians/Chaldeans/Syriacs | 23.2 /100 | #192 | Fair 11.4% |
| Greeks | 22.2 /100 | #193 | Fair 11.4% |
| Belizeans | 21.2 /100 | #194 | Fair 11.4% |
| Immigrants | Oceania | 20.9 /100 | #195 | Fair 11.4% |
| West Indians | 18.4 /100 | #196 | Poor 11.4% |
| Somalis | 18.2 /100 | #197 | Poor 11.4% |
| Immigrants | Jamaica | 16.3 /100 | #198 | Poor 11.5% |