Danish vs Immigrants from Netherlands Hearing Disability
COMPARE
Danish
Immigrants from Netherlands
Hearing Disability
Hearing Disability Comparison
Danes
Immigrants from Netherlands
3.6%
HEARING DISABILITY
0.0/ 100
METRIC RATING
276th/ 347
METRIC RANK
3.3%
HEARING DISABILITY
1.1/ 100
METRIC RATING
240th/ 347
METRIC RANK
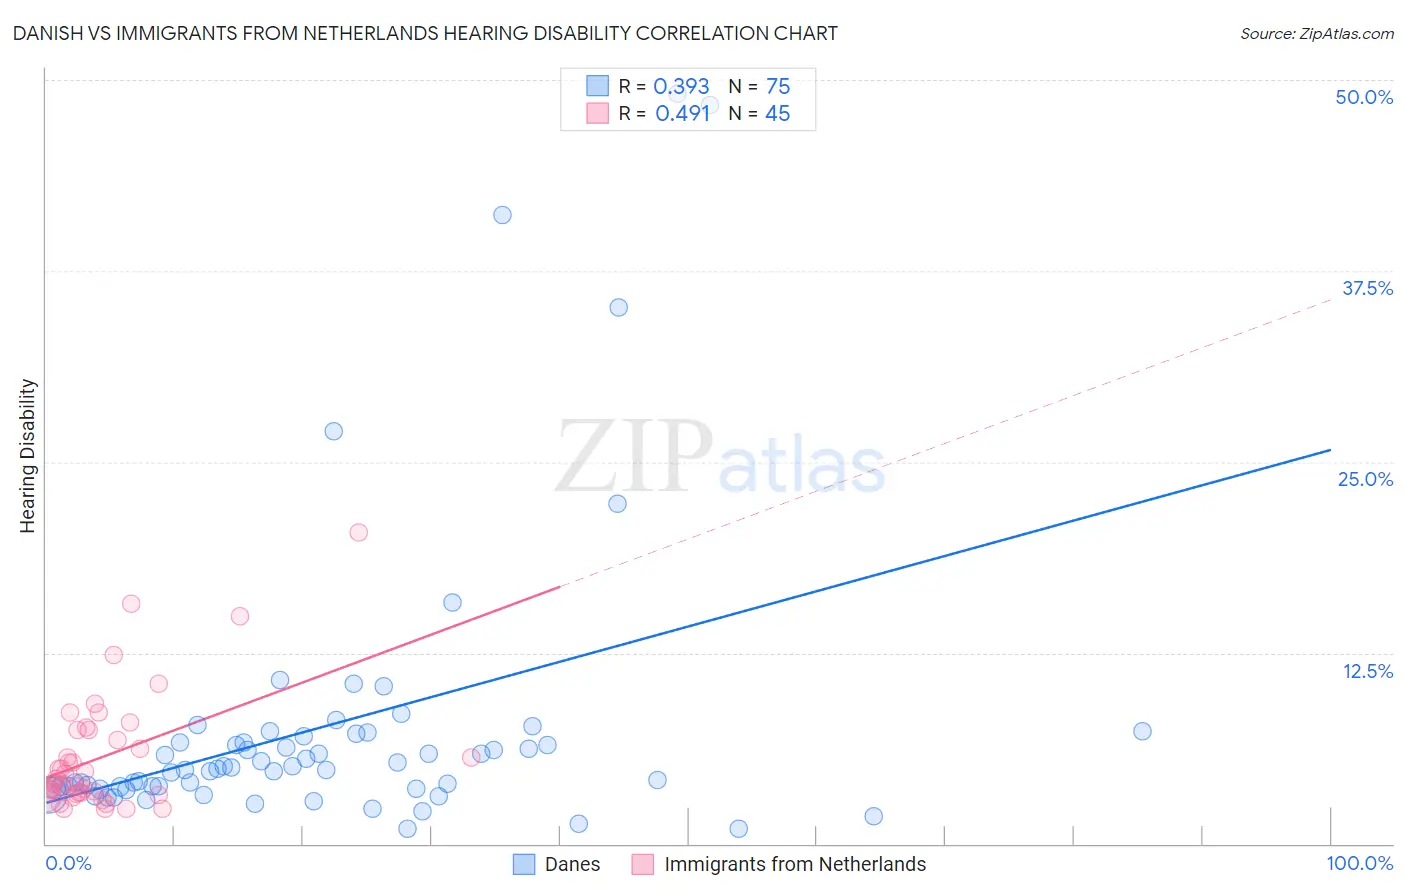
Danish vs Immigrants from Netherlands Hearing Disability Correlation Chart
The statistical analysis conducted on geographies consisting of 473,961,057 people shows a mild positive correlation between the proportion of Danes and percentage of population with hearing disability in the United States with a correlation coefficient (R) of 0.393 and weighted average of 3.6%. Similarly, the statistical analysis conducted on geographies consisting of 237,853,036 people shows a moderate positive correlation between the proportion of Immigrants from Netherlands and percentage of population with hearing disability in the United States with a correlation coefficient (R) of 0.491 and weighted average of 3.3%, a difference of 7.4%.
Hearing Disability Correlation Summary
| Measurement | Danish | Immigrants from Netherlands |
| Minimum | 0.96% | 2.3% |
| Maximum | 49.1% | 20.4% |
| Range | 48.2% | 18.1% |
| Mean | 7.7% | 5.7% |
| Median | 4.9% | 4.2% |
| Interquartile 25% (IQ1) | 3.7% | 3.3% |
| Interquartile 75% (IQ3) | 7.1% | 7.4% |
| Interquartile Range (IQR) | 3.4% | 4.1% |
| Standard Deviation (Sample) | 9.5% | 3.9% |
| Standard Deviation (Population) | 9.5% | 3.9% |
Similar Demographics by Hearing Disability
Demographics Similar to Danes by Hearing Disability
In terms of hearing disability, the demographic groups most similar to Danes are Czechoslovakian (3.6%, a difference of 0.12%), Swiss (3.5%, a difference of 0.32%), Puerto Rican (3.5%, a difference of 0.64%), Nonimmigrants (3.6%, a difference of 0.70%), and Fijian (3.5%, a difference of 0.72%).
| Demographics | Rating | Rank | Hearing Disability |
| Ute | 0.1 /100 | #269 | Tragic 3.5% |
| Europeans | 0.1 /100 | #270 | Tragic 3.5% |
| Czechs | 0.1 /100 | #271 | Tragic 3.5% |
| Fijians | 0.0 /100 | #272 | Tragic 3.5% |
| Puerto Ricans | 0.0 /100 | #273 | Tragic 3.5% |
| Swiss | 0.0 /100 | #274 | Tragic 3.5% |
| Czechoslovakians | 0.0 /100 | #275 | Tragic 3.6% |
| Danes | 0.0 /100 | #276 | Tragic 3.6% |
| Immigrants | Nonimmigrants | 0.0 /100 | #277 | Tragic 3.6% |
| Basques | 0.0 /100 | #278 | Tragic 3.6% |
| Slovaks | 0.0 /100 | #279 | Tragic 3.6% |
| French American Indians | 0.0 /100 | #280 | Tragic 3.6% |
| Scandinavians | 0.0 /100 | #281 | Tragic 3.6% |
| Swedes | 0.0 /100 | #282 | Tragic 3.6% |
| Blackfeet | 0.0 /100 | #283 | Tragic 3.6% |
Demographics Similar to Immigrants from Netherlands by Hearing Disability
In terms of hearing disability, the demographic groups most similar to Immigrants from Netherlands are Samoan (3.3%, a difference of 0.070%), Nepalese (3.3%, a difference of 0.18%), Yugoslavian (3.3%, a difference of 0.18%), Immigrants from Western Europe (3.3%, a difference of 0.35%), and Assyrian/Chaldean/Syriac (3.3%, a difference of 0.43%).
| Demographics | Rating | Rank | Hearing Disability |
| Estonians | 2.4 /100 | #233 | Tragic 3.3% |
| Central American Indians | 2.3 /100 | #234 | Tragic 3.3% |
| Guamanians/Chamorros | 2.2 /100 | #235 | Tragic 3.3% |
| Serbians | 2.2 /100 | #236 | Tragic 3.3% |
| Immigrants | Austria | 1.8 /100 | #237 | Tragic 3.3% |
| German Russians | 1.8 /100 | #238 | Tragic 3.3% |
| Nepalese | 1.2 /100 | #239 | Tragic 3.3% |
| Immigrants | Netherlands | 1.1 /100 | #240 | Tragic 3.3% |
| Samoans | 1.1 /100 | #241 | Tragic 3.3% |
| Yugoslavians | 1.0 /100 | #242 | Tragic 3.3% |
| Immigrants | Western Europe | 1.0 /100 | #243 | Tragic 3.3% |
| Assyrians/Chaldeans/Syriacs | 0.9 /100 | #244 | Tragic 3.3% |
| Immigrants | Scotland | 0.8 /100 | #245 | Tragic 3.3% |
| Immigrants | England | 0.7 /100 | #246 | Tragic 3.3% |
| Lithuanians | 0.6 /100 | #247 | Tragic 3.4% |