Danish vs English Hearing Disability
COMPARE
Danish
English
Hearing Disability
Hearing Disability Comparison
Danes
English
3.6%
HEARING DISABILITY
0.0/ 100
METRIC RATING
276th/ 347
METRIC RANK
3.8%
HEARING DISABILITY
0.0/ 100
METRIC RATING
305th/ 347
METRIC RANK
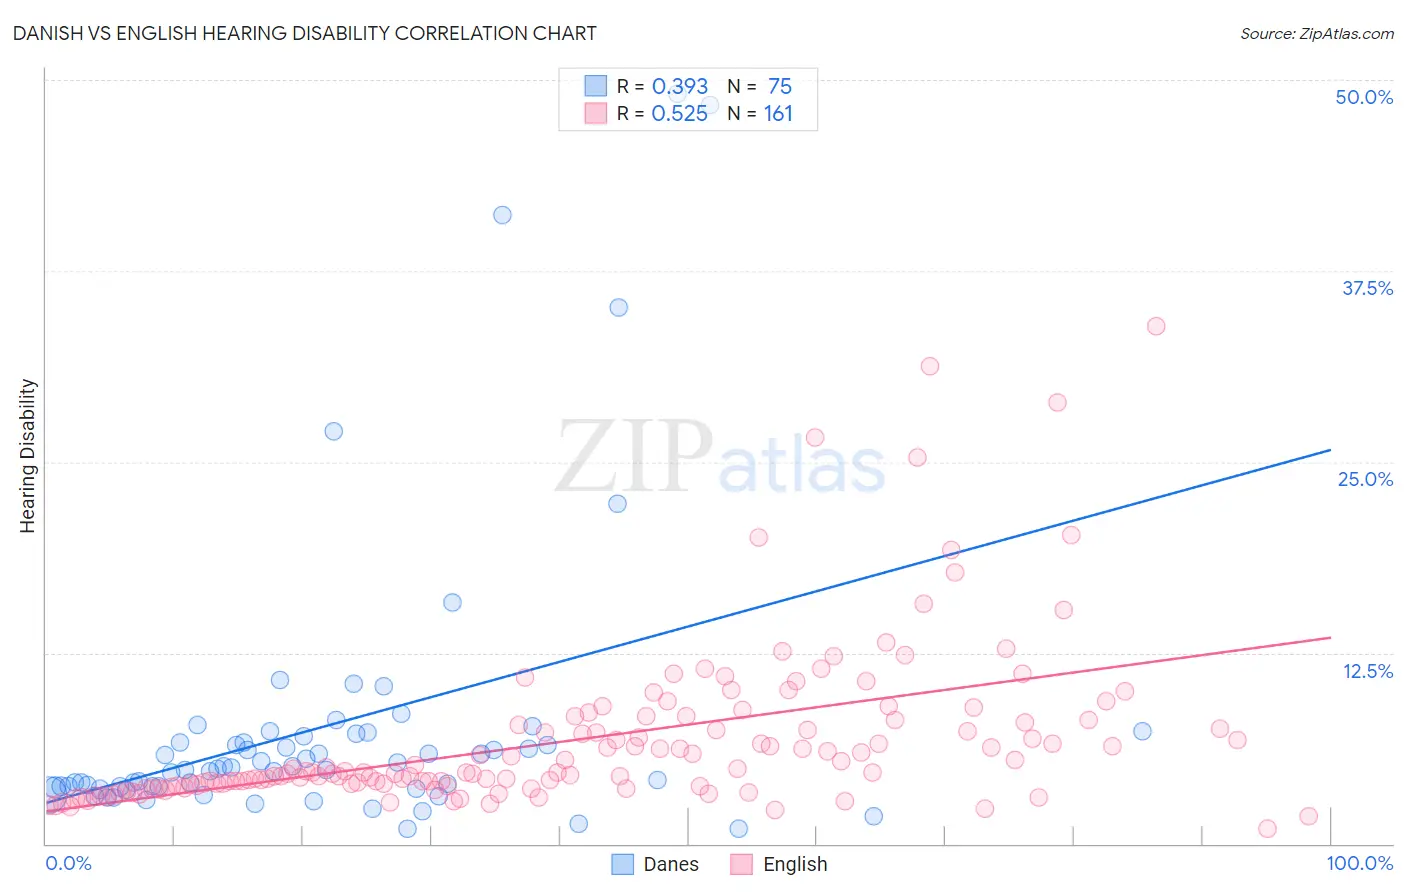
Danish vs English Hearing Disability Correlation Chart
The statistical analysis conducted on geographies consisting of 473,961,057 people shows a mild positive correlation between the proportion of Danes and percentage of population with hearing disability in the United States with a correlation coefficient (R) of 0.393 and weighted average of 3.6%. Similarly, the statistical analysis conducted on geographies consisting of 578,898,364 people shows a substantial positive correlation between the proportion of English and percentage of population with hearing disability in the United States with a correlation coefficient (R) of 0.525 and weighted average of 3.8%, a difference of 6.2%.
Hearing Disability Correlation Summary
| Measurement | Danish | English |
| Minimum | 0.96% | 1.0% |
| Maximum | 49.1% | 33.9% |
| Range | 48.2% | 32.9% |
| Mean | 7.7% | 6.8% |
| Median | 4.9% | 4.7% |
| Interquartile 25% (IQ1) | 3.7% | 3.8% |
| Interquartile 75% (IQ3) | 7.1% | 8.0% |
| Interquartile Range (IQR) | 3.4% | 4.2% |
| Standard Deviation (Sample) | 9.5% | 5.4% |
| Standard Deviation (Population) | 9.5% | 5.4% |
Similar Demographics by Hearing Disability
Demographics Similar to Danes by Hearing Disability
In terms of hearing disability, the demographic groups most similar to Danes are Czechoslovakian (3.6%, a difference of 0.12%), Swiss (3.5%, a difference of 0.32%), Puerto Rican (3.5%, a difference of 0.64%), Nonimmigrants (3.6%, a difference of 0.70%), and Fijian (3.5%, a difference of 0.72%).
| Demographics | Rating | Rank | Hearing Disability |
| Ute | 0.1 /100 | #269 | Tragic 3.5% |
| Europeans | 0.1 /100 | #270 | Tragic 3.5% |
| Czechs | 0.1 /100 | #271 | Tragic 3.5% |
| Fijians | 0.0 /100 | #272 | Tragic 3.5% |
| Puerto Ricans | 0.0 /100 | #273 | Tragic 3.5% |
| Swiss | 0.0 /100 | #274 | Tragic 3.5% |
| Czechoslovakians | 0.0 /100 | #275 | Tragic 3.6% |
| Danes | 0.0 /100 | #276 | Tragic 3.6% |
| Immigrants | Nonimmigrants | 0.0 /100 | #277 | Tragic 3.6% |
| Basques | 0.0 /100 | #278 | Tragic 3.6% |
| Slovaks | 0.0 /100 | #279 | Tragic 3.6% |
| French American Indians | 0.0 /100 | #280 | Tragic 3.6% |
| Scandinavians | 0.0 /100 | #281 | Tragic 3.6% |
| Swedes | 0.0 /100 | #282 | Tragic 3.6% |
| Blackfeet | 0.0 /100 | #283 | Tragic 3.6% |
Demographics Similar to English by Hearing Disability
In terms of hearing disability, the demographic groups most similar to English are French (3.8%, a difference of 0.57%), Marshallese (3.8%, a difference of 0.86%), Menominee (3.7%, a difference of 0.87%), Dutch (3.7%, a difference of 0.93%), and French Canadian (3.8%, a difference of 0.98%).
| Demographics | Rating | Rank | Hearing Disability |
| Celtics | 0.0 /100 | #298 | Tragic 3.7% |
| Germans | 0.0 /100 | #299 | Tragic 3.7% |
| Scottish | 0.0 /100 | #300 | Tragic 3.7% |
| Pennsylvania Germans | 0.0 /100 | #301 | Tragic 3.7% |
| Dutch | 0.0 /100 | #302 | Tragic 3.7% |
| Menominee | 0.0 /100 | #303 | Tragic 3.7% |
| French | 0.0 /100 | #304 | Tragic 3.8% |
| English | 0.0 /100 | #305 | Tragic 3.8% |
| Marshallese | 0.0 /100 | #306 | Tragic 3.8% |
| French Canadians | 0.0 /100 | #307 | Tragic 3.8% |
| Ottawa | 0.0 /100 | #308 | Tragic 3.8% |
| Scotch-Irish | 0.0 /100 | #309 | Tragic 3.8% |
| Cree | 0.0 /100 | #310 | Tragic 3.8% |
| Americans | 0.0 /100 | #311 | Tragic 3.9% |
| Cajuns | 0.0 /100 | #312 | Tragic 3.9% |