Norwegian vs Immigrants from Netherlands Hearing Disability
COMPARE
Norwegian
Immigrants from Netherlands
Hearing Disability
Hearing Disability Comparison
Norwegians
Immigrants from Netherlands
3.7%
HEARING DISABILITY
0.0/ 100
METRIC RATING
293rd/ 347
METRIC RANK
3.3%
HEARING DISABILITY
1.1/ 100
METRIC RATING
240th/ 347
METRIC RANK
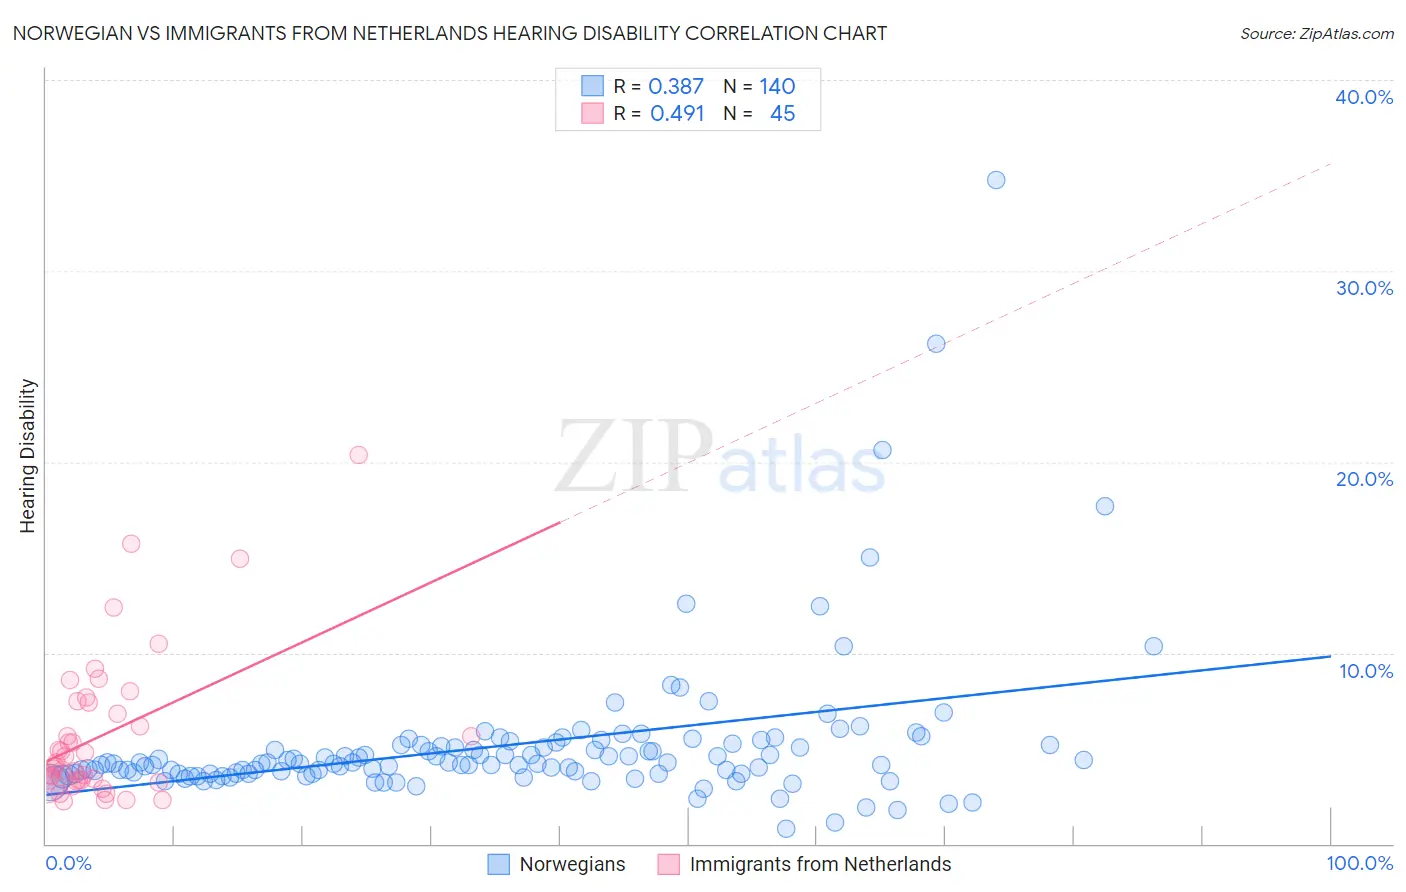
Norwegian vs Immigrants from Netherlands Hearing Disability Correlation Chart
The statistical analysis conducted on geographies consisting of 532,928,567 people shows a mild positive correlation between the proportion of Norwegians and percentage of population with hearing disability in the United States with a correlation coefficient (R) of 0.387 and weighted average of 3.7%. Similarly, the statistical analysis conducted on geographies consisting of 237,853,036 people shows a moderate positive correlation between the proportion of Immigrants from Netherlands and percentage of population with hearing disability in the United States with a correlation coefficient (R) of 0.491 and weighted average of 3.3%, a difference of 11.5%.
Hearing Disability Correlation Summary
| Measurement | Norwegian | Immigrants from Netherlands |
| Minimum | 0.76% | 2.3% |
| Maximum | 34.8% | 20.4% |
| Range | 34.0% | 18.1% |
| Mean | 5.2% | 5.7% |
| Median | 4.2% | 4.2% |
| Interquartile 25% (IQ1) | 3.7% | 3.3% |
| Interquartile 75% (IQ3) | 5.1% | 7.4% |
| Interquartile Range (IQR) | 1.5% | 4.1% |
| Standard Deviation (Sample) | 4.0% | 3.9% |
| Standard Deviation (Population) | 4.0% | 3.9% |
Similar Demographics by Hearing Disability
Demographics Similar to Norwegians by Hearing Disability
In terms of hearing disability, the demographic groups most similar to Norwegians are Native Hawaiian (3.7%, a difference of 0.060%), Finnish (3.7%, a difference of 0.12%), White/Caucasian (3.7%, a difference of 0.13%), Iroquois (3.7%, a difference of 0.24%), and Chinese (3.7%, a difference of 0.27%).
| Demographics | Rating | Rank | Hearing Disability |
| Delaware | 0.0 /100 | #286 | Tragic 3.6% |
| Spanish | 0.0 /100 | #287 | Tragic 3.7% |
| Irish | 0.0 /100 | #288 | Tragic 3.7% |
| Chinese | 0.0 /100 | #289 | Tragic 3.7% |
| Whites/Caucasians | 0.0 /100 | #290 | Tragic 3.7% |
| Finns | 0.0 /100 | #291 | Tragic 3.7% |
| Native Hawaiians | 0.0 /100 | #292 | Tragic 3.7% |
| Norwegians | 0.0 /100 | #293 | Tragic 3.7% |
| Iroquois | 0.0 /100 | #294 | Tragic 3.7% |
| Welsh | 0.0 /100 | #295 | Tragic 3.7% |
| Pima | 0.0 /100 | #296 | Tragic 3.7% |
| Immigrants | Azores | 0.0 /100 | #297 | Tragic 3.7% |
| Celtics | 0.0 /100 | #298 | Tragic 3.7% |
| Germans | 0.0 /100 | #299 | Tragic 3.7% |
| Scottish | 0.0 /100 | #300 | Tragic 3.7% |
Demographics Similar to Immigrants from Netherlands by Hearing Disability
In terms of hearing disability, the demographic groups most similar to Immigrants from Netherlands are Samoan (3.3%, a difference of 0.070%), Nepalese (3.3%, a difference of 0.18%), Yugoslavian (3.3%, a difference of 0.18%), Immigrants from Western Europe (3.3%, a difference of 0.35%), and Assyrian/Chaldean/Syriac (3.3%, a difference of 0.43%).
| Demographics | Rating | Rank | Hearing Disability |
| Estonians | 2.4 /100 | #233 | Tragic 3.3% |
| Central American Indians | 2.3 /100 | #234 | Tragic 3.3% |
| Guamanians/Chamorros | 2.2 /100 | #235 | Tragic 3.3% |
| Serbians | 2.2 /100 | #236 | Tragic 3.3% |
| Immigrants | Austria | 1.8 /100 | #237 | Tragic 3.3% |
| German Russians | 1.8 /100 | #238 | Tragic 3.3% |
| Nepalese | 1.2 /100 | #239 | Tragic 3.3% |
| Immigrants | Netherlands | 1.1 /100 | #240 | Tragic 3.3% |
| Samoans | 1.1 /100 | #241 | Tragic 3.3% |
| Yugoslavians | 1.0 /100 | #242 | Tragic 3.3% |
| Immigrants | Western Europe | 1.0 /100 | #243 | Tragic 3.3% |
| Assyrians/Chaldeans/Syriacs | 0.9 /100 | #244 | Tragic 3.3% |
| Immigrants | Scotland | 0.8 /100 | #245 | Tragic 3.3% |
| Immigrants | England | 0.7 /100 | #246 | Tragic 3.3% |
| Lithuanians | 0.6 /100 | #247 | Tragic 3.4% |