Cajun vs Immigrants from Netherlands Hearing Disability
COMPARE
Cajun
Immigrants from Netherlands
Hearing Disability
Hearing Disability Comparison
Cajuns
Immigrants from Netherlands
3.9%
HEARING DISABILITY
0.0/ 100
METRIC RATING
312th/ 347
METRIC RANK
3.3%
HEARING DISABILITY
1.1/ 100
METRIC RATING
240th/ 347
METRIC RANK
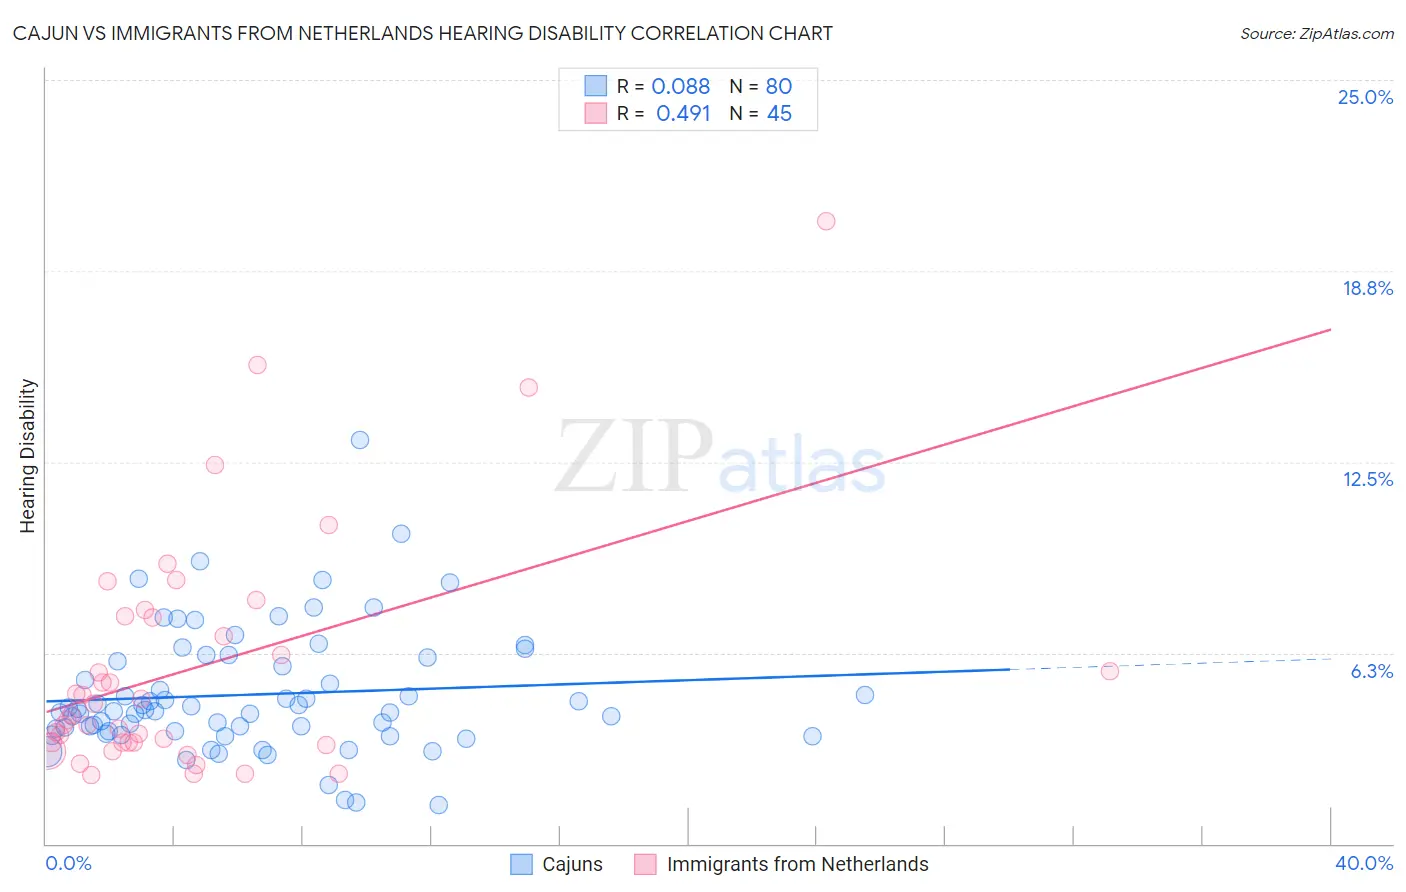
Cajun vs Immigrants from Netherlands Hearing Disability Correlation Chart
The statistical analysis conducted on geographies consisting of 149,694,482 people shows a slight positive correlation between the proportion of Cajuns and percentage of population with hearing disability in the United States with a correlation coefficient (R) of 0.088 and weighted average of 3.9%. Similarly, the statistical analysis conducted on geographies consisting of 237,853,036 people shows a moderate positive correlation between the proportion of Immigrants from Netherlands and percentage of population with hearing disability in the United States with a correlation coefficient (R) of 0.491 and weighted average of 3.3%, a difference of 18.9%.
Hearing Disability Correlation Summary
| Measurement | Cajun | Immigrants from Netherlands |
| Minimum | 1.3% | 2.3% |
| Maximum | 13.2% | 20.4% |
| Range | 11.9% | 18.1% |
| Mean | 4.9% | 5.7% |
| Median | 4.4% | 4.2% |
| Interquartile 25% (IQ1) | 3.7% | 3.3% |
| Interquartile 75% (IQ3) | 6.0% | 7.4% |
| Interquartile Range (IQR) | 2.4% | 4.1% |
| Standard Deviation (Sample) | 2.0% | 3.9% |
| Standard Deviation (Population) | 2.0% | 3.9% |
Similar Demographics by Hearing Disability
Demographics Similar to Cajuns by Hearing Disability
In terms of hearing disability, the demographic groups most similar to Cajuns are Hopi (3.9%, a difference of 0.11%), Yakama (3.9%, a difference of 0.28%), Puget Sound Salish (3.9%, a difference of 0.29%), Spanish American (4.0%, a difference of 0.49%), and Comanche (4.0%, a difference of 0.62%).
| Demographics | Rating | Rank | Hearing Disability |
| English | 0.0 /100 | #305 | Tragic 3.8% |
| Marshallese | 0.0 /100 | #306 | Tragic 3.8% |
| French Canadians | 0.0 /100 | #307 | Tragic 3.8% |
| Ottawa | 0.0 /100 | #308 | Tragic 3.8% |
| Scotch-Irish | 0.0 /100 | #309 | Tragic 3.8% |
| Cree | 0.0 /100 | #310 | Tragic 3.8% |
| Americans | 0.0 /100 | #311 | Tragic 3.9% |
| Cajuns | 0.0 /100 | #312 | Tragic 3.9% |
| Hopi | 0.0 /100 | #313 | Tragic 3.9% |
| Yakama | 0.0 /100 | #314 | Tragic 3.9% |
| Puget Sound Salish | 0.0 /100 | #315 | Tragic 3.9% |
| Spanish Americans | 0.0 /100 | #316 | Tragic 4.0% |
| Comanche | 0.0 /100 | #317 | Tragic 4.0% |
| Cheyenne | 0.0 /100 | #318 | Tragic 4.0% |
| Chippewa | 0.0 /100 | #319 | Tragic 4.0% |
Demographics Similar to Immigrants from Netherlands by Hearing Disability
In terms of hearing disability, the demographic groups most similar to Immigrants from Netherlands are Samoan (3.3%, a difference of 0.070%), Nepalese (3.3%, a difference of 0.18%), Yugoslavian (3.3%, a difference of 0.18%), Immigrants from Western Europe (3.3%, a difference of 0.35%), and Assyrian/Chaldean/Syriac (3.3%, a difference of 0.43%).
| Demographics | Rating | Rank | Hearing Disability |
| Estonians | 2.4 /100 | #233 | Tragic 3.3% |
| Central American Indians | 2.3 /100 | #234 | Tragic 3.3% |
| Guamanians/Chamorros | 2.2 /100 | #235 | Tragic 3.3% |
| Serbians | 2.2 /100 | #236 | Tragic 3.3% |
| Immigrants | Austria | 1.8 /100 | #237 | Tragic 3.3% |
| German Russians | 1.8 /100 | #238 | Tragic 3.3% |
| Nepalese | 1.2 /100 | #239 | Tragic 3.3% |
| Immigrants | Netherlands | 1.1 /100 | #240 | Tragic 3.3% |
| Samoans | 1.1 /100 | #241 | Tragic 3.3% |
| Yugoslavians | 1.0 /100 | #242 | Tragic 3.3% |
| Immigrants | Western Europe | 1.0 /100 | #243 | Tragic 3.3% |
| Assyrians/Chaldeans/Syriacs | 0.9 /100 | #244 | Tragic 3.3% |
| Immigrants | Scotland | 0.8 /100 | #245 | Tragic 3.3% |
| Immigrants | England | 0.7 /100 | #246 | Tragic 3.3% |
| Lithuanians | 0.6 /100 | #247 | Tragic 3.4% |