Danish vs Immigrants from Dominican Republic Hearing Disability
COMPARE
Danish
Immigrants from Dominican Republic
Hearing Disability
Hearing Disability Comparison
Danes
Immigrants from Dominican Republic
3.6%
HEARING DISABILITY
0.0/ 100
METRIC RATING
276th/ 347
METRIC RANK
2.4%
HEARING DISABILITY
100.0/ 100
METRIC RATING
9th/ 347
METRIC RANK
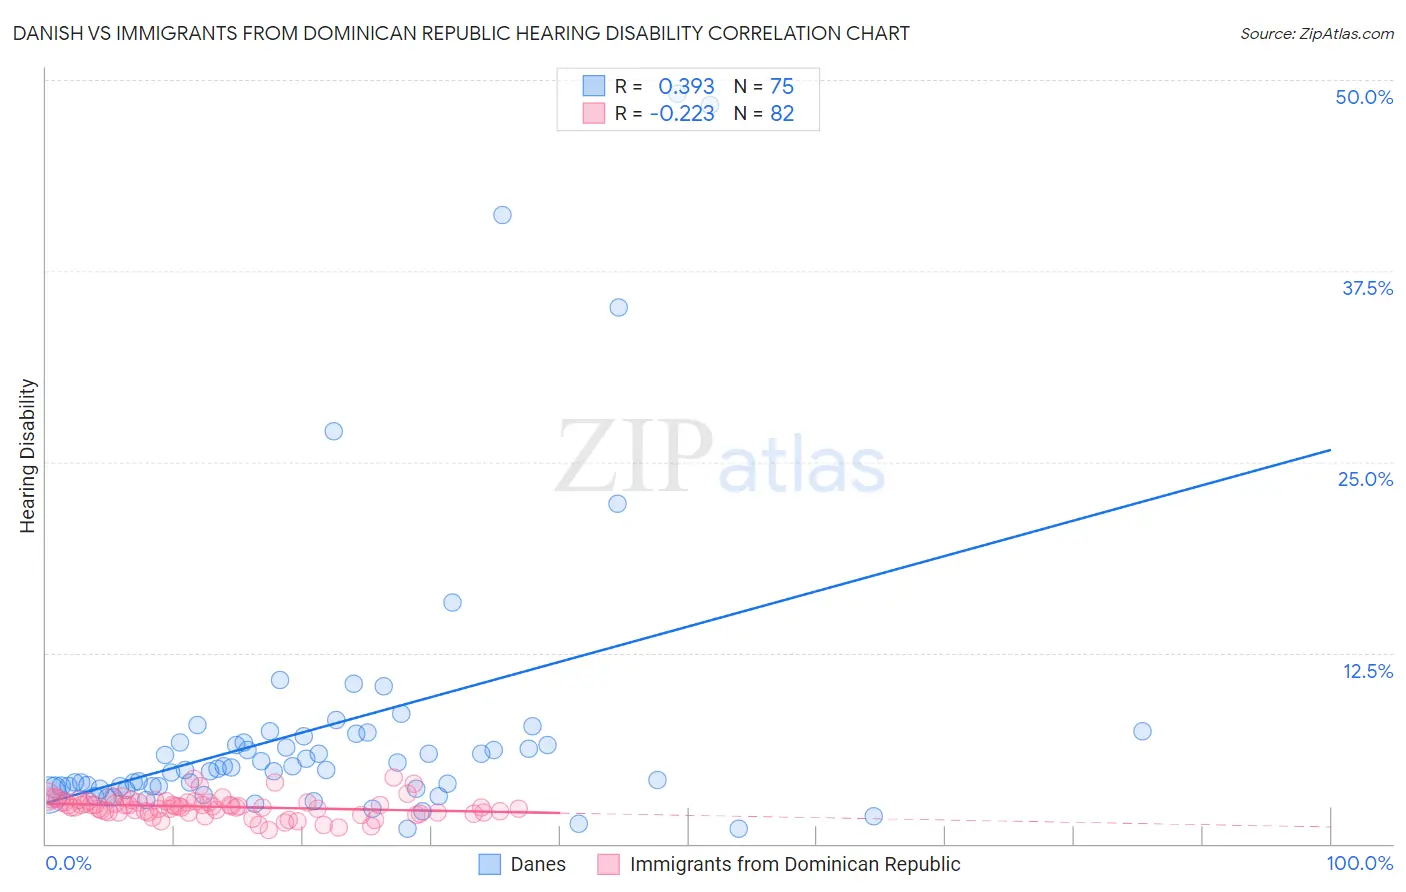
Danish vs Immigrants from Dominican Republic Hearing Disability Correlation Chart
The statistical analysis conducted on geographies consisting of 473,961,057 people shows a mild positive correlation between the proportion of Danes and percentage of population with hearing disability in the United States with a correlation coefficient (R) of 0.393 and weighted average of 3.6%. Similarly, the statistical analysis conducted on geographies consisting of 275,054,996 people shows a weak negative correlation between the proportion of Immigrants from Dominican Republic and percentage of population with hearing disability in the United States with a correlation coefficient (R) of -0.223 and weighted average of 2.4%, a difference of 45.2%.
Hearing Disability Correlation Summary
| Measurement | Danish | Immigrants from Dominican Republic |
| Minimum | 0.96% | 0.89% |
| Maximum | 49.1% | 4.4% |
| Range | 48.2% | 3.5% |
| Mean | 7.7% | 2.4% |
| Median | 4.9% | 2.4% |
| Interquartile 25% (IQ1) | 3.7% | 2.1% |
| Interquartile 75% (IQ3) | 7.1% | 2.8% |
| Interquartile Range (IQR) | 3.4% | 0.69% |
| Standard Deviation (Sample) | 9.5% | 0.66% |
| Standard Deviation (Population) | 9.5% | 0.66% |
Similar Demographics by Hearing Disability
Demographics Similar to Danes by Hearing Disability
In terms of hearing disability, the demographic groups most similar to Danes are Czechoslovakian (3.6%, a difference of 0.12%), Swiss (3.5%, a difference of 0.32%), Puerto Rican (3.5%, a difference of 0.64%), Nonimmigrants (3.6%, a difference of 0.70%), and Fijian (3.5%, a difference of 0.72%).
| Demographics | Rating | Rank | Hearing Disability |
| Ute | 0.1 /100 | #269 | Tragic 3.5% |
| Europeans | 0.1 /100 | #270 | Tragic 3.5% |
| Czechs | 0.1 /100 | #271 | Tragic 3.5% |
| Fijians | 0.0 /100 | #272 | Tragic 3.5% |
| Puerto Ricans | 0.0 /100 | #273 | Tragic 3.5% |
| Swiss | 0.0 /100 | #274 | Tragic 3.5% |
| Czechoslovakians | 0.0 /100 | #275 | Tragic 3.6% |
| Danes | 0.0 /100 | #276 | Tragic 3.6% |
| Immigrants | Nonimmigrants | 0.0 /100 | #277 | Tragic 3.6% |
| Basques | 0.0 /100 | #278 | Tragic 3.6% |
| Slovaks | 0.0 /100 | #279 | Tragic 3.6% |
| French American Indians | 0.0 /100 | #280 | Tragic 3.6% |
| Scandinavians | 0.0 /100 | #281 | Tragic 3.6% |
| Swedes | 0.0 /100 | #282 | Tragic 3.6% |
| Blackfeet | 0.0 /100 | #283 | Tragic 3.6% |
Demographics Similar to Immigrants from Dominican Republic by Hearing Disability
In terms of hearing disability, the demographic groups most similar to Immigrants from Dominican Republic are British West Indian (2.4%, a difference of 0.78%), Immigrants from Bangladesh (2.4%, a difference of 1.0%), Immigrants from Ecuador (2.5%, a difference of 1.0%), Immigrants from Trinidad and Tobago (2.5%, a difference of 1.6%), and Trinidadian and Tobagonian (2.5%, a difference of 1.9%).
| Demographics | Rating | Rank | Hearing Disability |
| Immigrants | St. Vincent and the Grenadines | 100.0 /100 | #2 | Exceptional 2.3% |
| Guyanese | 100.0 /100 | #3 | Exceptional 2.3% |
| Immigrants | Guyana | 100.0 /100 | #4 | Exceptional 2.3% |
| Immigrants | Barbados | 100.0 /100 | #5 | Exceptional 2.4% |
| Vietnamese | 100.0 /100 | #6 | Exceptional 2.4% |
| Immigrants | Bangladesh | 100.0 /100 | #7 | Exceptional 2.4% |
| British West Indians | 100.0 /100 | #8 | Exceptional 2.4% |
| Immigrants | Dominican Republic | 100.0 /100 | #9 | Exceptional 2.4% |
| Immigrants | Ecuador | 99.9 /100 | #10 | Exceptional 2.5% |
| Immigrants | Trinidad and Tobago | 99.9 /100 | #11 | Exceptional 2.5% |
| Trinidadians and Tobagonians | 99.9 /100 | #12 | Exceptional 2.5% |
| Sierra Leoneans | 99.9 /100 | #13 | Exceptional 2.5% |
| Ecuadorians | 99.9 /100 | #14 | Exceptional 2.5% |
| Barbadians | 99.9 /100 | #15 | Exceptional 2.5% |
| Immigrants | West Indies | 99.9 /100 | #16 | Exceptional 2.5% |