Danish vs Immigrants from Guyana Child Poverty Under the Age of 5
COMPARE
Danish
Immigrants from Guyana
Child Poverty Under the Age of 5
Child Poverty Under the Age of 5 Comparison
Danes
Immigrants from Guyana
14.9%
CHILD POVERTY UNDER THE AGE OF 5
99.4/ 100
METRIC RATING
55th/ 347
METRIC RANK
19.6%
CHILD POVERTY UNDER THE AGE OF 5
0.5/ 100
METRIC RATING
242nd/ 347
METRIC RANK
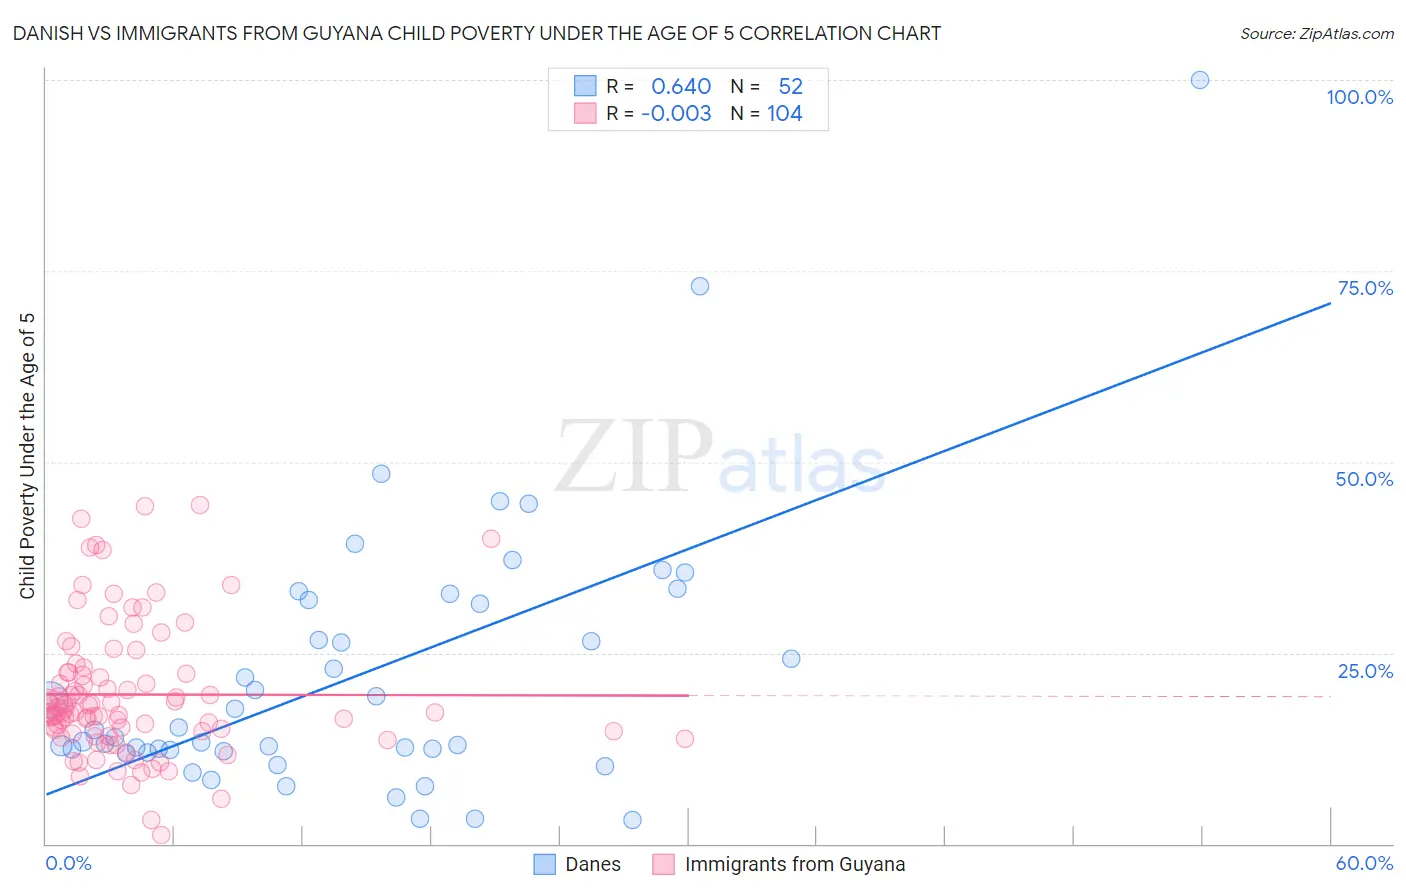
Danish vs Immigrants from Guyana Child Poverty Under the Age of 5 Correlation Chart
The statistical analysis conducted on geographies consisting of 447,094,806 people shows a significant positive correlation between the proportion of Danes and poverty level among children under the age of 5 in the United States with a correlation coefficient (R) of 0.640 and weighted average of 14.9%. Similarly, the statistical analysis conducted on geographies consisting of 179,217,429 people shows no correlation between the proportion of Immigrants from Guyana and poverty level among children under the age of 5 in the United States with a correlation coefficient (R) of -0.003 and weighted average of 19.6%, a difference of 31.5%.
Child Poverty Under the Age of 5 Correlation Summary
| Measurement | Danish | Immigrants from Guyana |
| Minimum | 3.2% | 1.1% |
| Maximum | 100.0% | 44.4% |
| Range | 96.8% | 43.2% |
| Mean | 22.1% | 19.5% |
| Median | 14.4% | 17.2% |
| Interquartile 25% (IQ1) | 12.2% | 14.7% |
| Interquartile 75% (IQ3) | 31.7% | 22.3% |
| Interquartile Range (IQR) | 19.5% | 7.6% |
| Standard Deviation (Sample) | 17.6% | 8.6% |
| Standard Deviation (Population) | 17.5% | 8.6% |
Similar Demographics by Child Poverty Under the Age of 5
Demographics Similar to Danes by Child Poverty Under the Age of 5
In terms of child poverty under the age of 5, the demographic groups most similar to Danes are Immigrants from Israel (14.9%, a difference of 0.060%), Luxembourger (14.9%, a difference of 0.070%), Immigrants from Pakistan (14.9%, a difference of 0.070%), Egyptian (14.9%, a difference of 0.15%), and Swedish (15.0%, a difference of 0.20%).
| Demographics | Rating | Rank | Child Poverty Under the Age of 5 |
| Immigrants | Czechoslovakia | 99.6 /100 | #48 | Exceptional 14.8% |
| Immigrants | Bulgaria | 99.6 /100 | #49 | Exceptional 14.8% |
| Immigrants | Northern Europe | 99.6 /100 | #50 | Exceptional 14.8% |
| Estonians | 99.6 /100 | #51 | Exceptional 14.8% |
| Immigrants | Serbia | 99.5 /100 | #52 | Exceptional 14.9% |
| Luxembourgers | 99.4 /100 | #53 | Exceptional 14.9% |
| Immigrants | Israel | 99.4 /100 | #54 | Exceptional 14.9% |
| Danes | 99.4 /100 | #55 | Exceptional 14.9% |
| Immigrants | Pakistan | 99.4 /100 | #56 | Exceptional 14.9% |
| Egyptians | 99.4 /100 | #57 | Exceptional 14.9% |
| Swedes | 99.4 /100 | #58 | Exceptional 15.0% |
| Paraguayans | 99.4 /100 | #59 | Exceptional 15.0% |
| Immigrants | Russia | 99.3 /100 | #60 | Exceptional 15.0% |
| Immigrants | Poland | 99.1 /100 | #61 | Exceptional 15.1% |
| Immigrants | Eastern Europe | 99.1 /100 | #62 | Exceptional 15.1% |
Demographics Similar to Immigrants from Guyana by Child Poverty Under the Age of 5
In terms of child poverty under the age of 5, the demographic groups most similar to Immigrants from Guyana are Osage (19.6%, a difference of 0.10%), Alaska Native (19.6%, a difference of 0.11%), Immigrants from Ghana (19.6%, a difference of 0.12%), Immigrants from Ecuador (19.6%, a difference of 0.18%), and Immigrants from Western Africa (19.7%, a difference of 0.31%).
| Demographics | Rating | Rank | Child Poverty Under the Age of 5 |
| Immigrants | Laos | 0.8 /100 | #235 | Tragic 19.4% |
| Immigrants | Trinidad and Tobago | 0.8 /100 | #236 | Tragic 19.4% |
| Immigrants | Cabo Verde | 0.6 /100 | #237 | Tragic 19.5% |
| Salvadorans | 0.6 /100 | #238 | Tragic 19.5% |
| Vietnamese | 0.6 /100 | #239 | Tragic 19.5% |
| Immigrants | Ecuador | 0.5 /100 | #240 | Tragic 19.6% |
| Alaska Natives | 0.5 /100 | #241 | Tragic 19.6% |
| Immigrants | Guyana | 0.5 /100 | #242 | Tragic 19.6% |
| Osage | 0.5 /100 | #243 | Tragic 19.6% |
| Immigrants | Ghana | 0.5 /100 | #244 | Tragic 19.6% |
| Immigrants | Western Africa | 0.4 /100 | #245 | Tragic 19.7% |
| Cree | 0.4 /100 | #246 | Tragic 19.7% |
| Guyanese | 0.4 /100 | #247 | Tragic 19.7% |
| Marshallese | 0.4 /100 | #248 | Tragic 19.7% |
| Immigrants | Middle Africa | 0.4 /100 | #249 | Tragic 19.7% |