Bulgarian vs Immigrants from Congo Male Disability
COMPARE
Bulgarian
Immigrants from Congo
Male Disability
Male Disability Comparison
Bulgarians
Immigrants from Congo
10.6%
MALE DISABILITY
98.1/ 100
METRIC RATING
84th/ 347
METRIC RANK
11.7%
MALE DISABILITY
3.7/ 100
METRIC RATING
221st/ 347
METRIC RANK
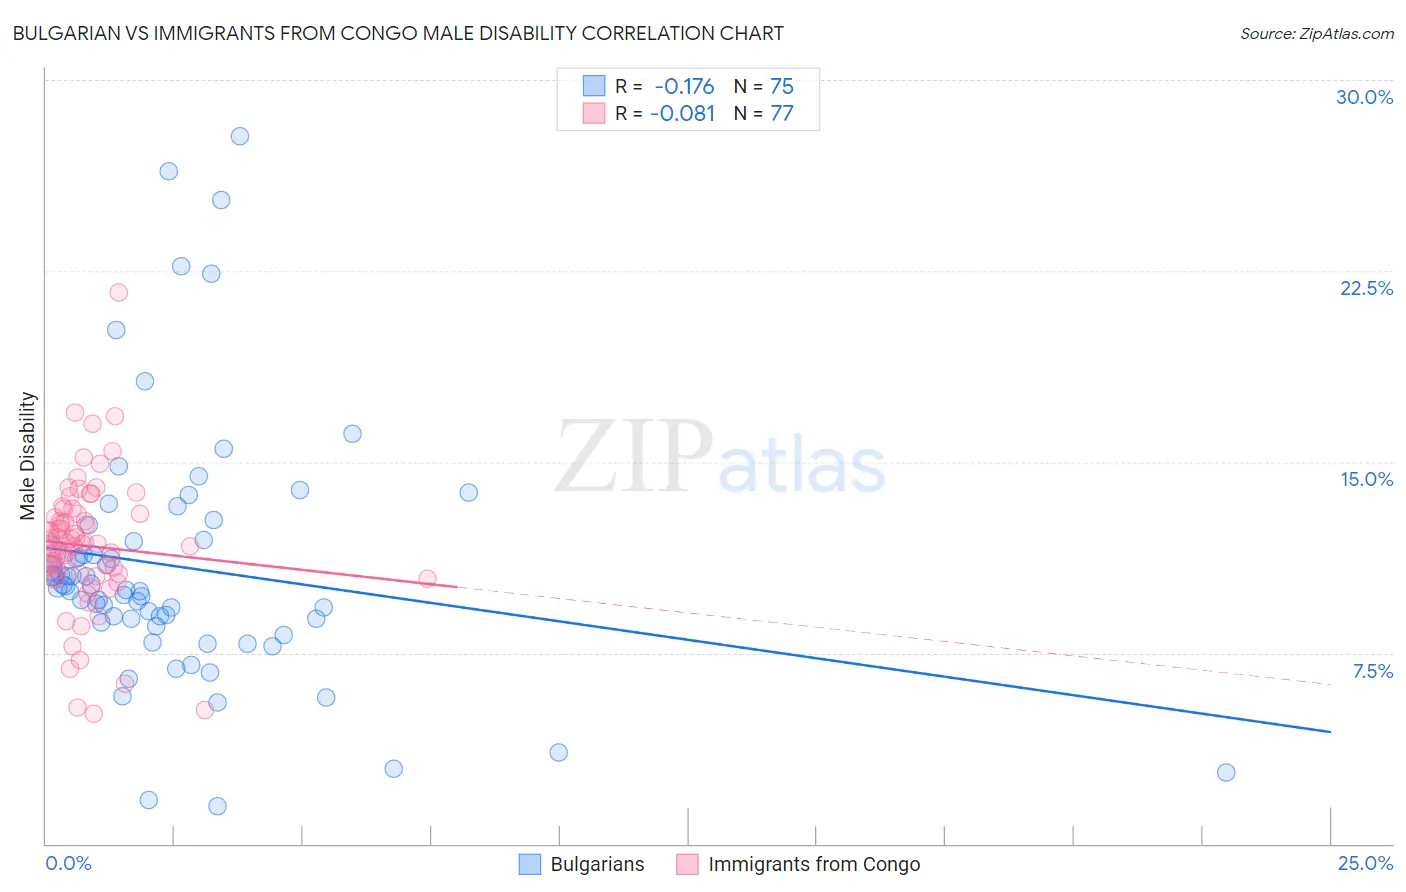
Bulgarian vs Immigrants from Congo Male Disability Correlation Chart
The statistical analysis conducted on geographies consisting of 205,628,995 people shows a poor negative correlation between the proportion of Bulgarians and percentage of males with a disability in the United States with a correlation coefficient (R) of -0.176 and weighted average of 10.6%. Similarly, the statistical analysis conducted on geographies consisting of 92,121,223 people shows a slight negative correlation between the proportion of Immigrants from Congo and percentage of males with a disability in the United States with a correlation coefficient (R) of -0.081 and weighted average of 11.7%, a difference of 10.5%.
Male Disability Correlation Summary
| Measurement | Bulgarian | Immigrants from Congo |
| Minimum | 1.5% | 5.1% |
| Maximum | 27.8% | 21.7% |
| Range | 26.4% | 16.5% |
| Mean | 10.9% | 11.7% |
| Median | 10.0% | 11.8% |
| Interquartile 25% (IQ1) | 8.7% | 10.6% |
| Interquartile 75% (IQ3) | 11.9% | 12.9% |
| Interquartile Range (IQR) | 3.2% | 2.4% |
| Standard Deviation (Sample) | 5.0% | 2.7% |
| Standard Deviation (Population) | 5.0% | 2.6% |
Similar Demographics by Male Disability
Demographics Similar to Bulgarians by Male Disability
In terms of male disability, the demographic groups most similar to Bulgarians are Immigrants from Poland (10.6%, a difference of 0.010%), Immigrants from Guyana (10.6%, a difference of 0.080%), Immigrants from Chile (10.6%, a difference of 0.14%), Sri Lankan (10.6%, a difference of 0.18%), and Immigrants from Ireland (10.6%, a difference of 0.18%).
| Demographics | Rating | Rank | Male Disability |
| Laotians | 98.6 /100 | #77 | Exceptional 10.6% |
| Immigrants | Russia | 98.6 /100 | #78 | Exceptional 10.6% |
| Zimbabweans | 98.4 /100 | #79 | Exceptional 10.6% |
| Immigrants | Jordan | 98.4 /100 | #80 | Exceptional 10.6% |
| Immigrants | Chile | 98.3 /100 | #81 | Exceptional 10.6% |
| Immigrants | Guyana | 98.2 /100 | #82 | Exceptional 10.6% |
| Immigrants | Poland | 98.1 /100 | #83 | Exceptional 10.6% |
| Bulgarians | 98.1 /100 | #84 | Exceptional 10.6% |
| Sri Lankans | 97.9 /100 | #85 | Exceptional 10.6% |
| Immigrants | Ireland | 97.9 /100 | #86 | Exceptional 10.6% |
| Immigrants | Vietnam | 97.9 /100 | #87 | Exceptional 10.6% |
| Immigrants | Western Asia | 97.8 /100 | #88 | Exceptional 10.6% |
| Immigrants | Nicaragua | 97.8 /100 | #89 | Exceptional 10.6% |
| Immigrants | Morocco | 97.7 /100 | #90 | Exceptional 10.6% |
| Immigrants | France | 97.6 /100 | #91 | Exceptional 10.6% |
Demographics Similar to Immigrants from Congo by Male Disability
In terms of male disability, the demographic groups most similar to Immigrants from Congo are Immigrants from Western Europe (11.7%, a difference of 0.010%), Panamanian (11.7%, a difference of 0.020%), Immigrants from England (11.7%, a difference of 0.080%), Alsatian (11.7%, a difference of 0.15%), and Immigrants from Bahamas (11.7%, a difference of 0.24%).
| Demographics | Rating | Rank | Male Disability |
| Lithuanians | 6.6 /100 | #214 | Tragic 11.6% |
| Indonesians | 5.9 /100 | #215 | Tragic 11.6% |
| Immigrants | Dominican Republic | 4.9 /100 | #216 | Tragic 11.7% |
| Immigrants | Dominica | 4.6 /100 | #217 | Tragic 11.7% |
| Immigrants | England | 4.0 /100 | #218 | Tragic 11.7% |
| Panamanians | 3.8 /100 | #219 | Tragic 11.7% |
| Immigrants | Western Europe | 3.8 /100 | #220 | Tragic 11.7% |
| Immigrants | Congo | 3.7 /100 | #221 | Tragic 11.7% |
| Alsatians | 3.3 /100 | #222 | Tragic 11.7% |
| Immigrants | Bahamas | 3.2 /100 | #223 | Tragic 11.7% |
| Japanese | 3.1 /100 | #224 | Tragic 11.7% |
| Liberians | 3.1 /100 | #225 | Tragic 11.8% |
| Sub-Saharan Africans | 2.8 /100 | #226 | Tragic 11.8% |
| Austrians | 2.5 /100 | #227 | Tragic 11.8% |
| Hispanics or Latinos | 2.3 /100 | #228 | Tragic 11.8% |