Senegalese vs English Hearing Disability
COMPARE
Senegalese
English
Hearing Disability
Hearing Disability Comparison
Senegalese
English
2.6%
HEARING DISABILITY
99.4/ 100
METRIC RATING
43rd/ 347
METRIC RANK
3.8%
HEARING DISABILITY
0.0/ 100
METRIC RATING
305th/ 347
METRIC RANK
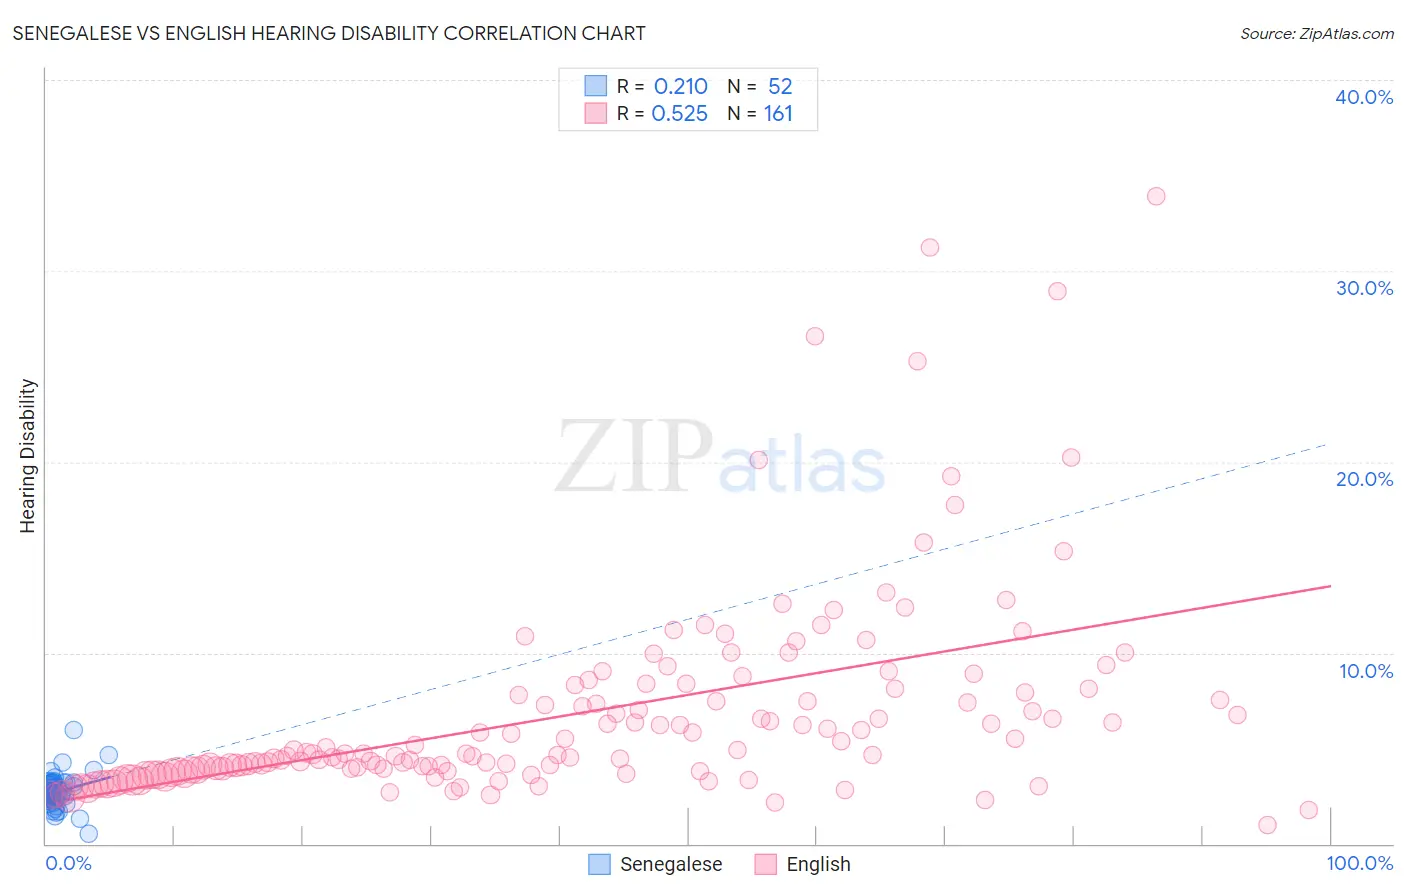
Senegalese vs English Hearing Disability Correlation Chart
The statistical analysis conducted on geographies consisting of 78,133,059 people shows a weak positive correlation between the proportion of Senegalese and percentage of population with hearing disability in the United States with a correlation coefficient (R) of 0.210 and weighted average of 2.6%. Similarly, the statistical analysis conducted on geographies consisting of 578,898,364 people shows a substantial positive correlation between the proportion of English and percentage of population with hearing disability in the United States with a correlation coefficient (R) of 0.525 and weighted average of 3.8%, a difference of 43.3%.
Hearing Disability Correlation Summary
| Measurement | Senegalese | English |
| Minimum | 0.50% | 1.0% |
| Maximum | 6.0% | 33.9% |
| Range | 5.5% | 32.9% |
| Mean | 2.7% | 6.8% |
| Median | 2.7% | 4.7% |
| Interquartile 25% (IQ1) | 2.4% | 3.8% |
| Interquartile 75% (IQ3) | 3.2% | 8.0% |
| Interquartile Range (IQR) | 0.80% | 4.2% |
| Standard Deviation (Sample) | 0.85% | 5.4% |
| Standard Deviation (Population) | 0.84% | 5.4% |
Similar Demographics by Hearing Disability
Demographics Similar to Senegalese by Hearing Disability
In terms of hearing disability, the demographic groups most similar to Senegalese are Immigrants from Taiwan (2.6%, a difference of 0.010%), West Indian (2.6%, a difference of 0.010%), Nigerian (2.6%, a difference of 0.22%), Venezuelan (2.6%, a difference of 0.25%), and Haitian (2.6%, a difference of 0.35%).
| Demographics | Rating | Rank | Hearing Disability |
| Okinawans | 99.6 /100 | #36 | Exceptional 2.6% |
| Immigrants | Western Africa | 99.6 /100 | #37 | Exceptional 2.6% |
| Immigrants | Jamaica | 99.5 /100 | #38 | Exceptional 2.6% |
| Immigrants | China | 99.5 /100 | #39 | Exceptional 2.6% |
| Haitians | 99.5 /100 | #40 | Exceptional 2.6% |
| Immigrants | Taiwan | 99.4 /100 | #41 | Exceptional 2.6% |
| West Indians | 99.4 /100 | #42 | Exceptional 2.6% |
| Senegalese | 99.4 /100 | #43 | Exceptional 2.6% |
| Nigerians | 99.4 /100 | #44 | Exceptional 2.6% |
| Venezuelans | 99.4 /100 | #45 | Exceptional 2.6% |
| Immigrants | Dominica | 99.3 /100 | #46 | Exceptional 2.6% |
| Immigrants | Israel | 99.3 /100 | #47 | Exceptional 2.6% |
| Immigrants | Singapore | 99.3 /100 | #48 | Exceptional 2.6% |
| Immigrants | South America | 99.2 /100 | #49 | Exceptional 2.7% |
| Paraguayans | 99.2 /100 | #50 | Exceptional 2.7% |
Demographics Similar to English by Hearing Disability
In terms of hearing disability, the demographic groups most similar to English are French (3.8%, a difference of 0.57%), Marshallese (3.8%, a difference of 0.86%), Menominee (3.7%, a difference of 0.87%), Dutch (3.7%, a difference of 0.93%), and French Canadian (3.8%, a difference of 0.98%).
| Demographics | Rating | Rank | Hearing Disability |
| Celtics | 0.0 /100 | #298 | Tragic 3.7% |
| Germans | 0.0 /100 | #299 | Tragic 3.7% |
| Scottish | 0.0 /100 | #300 | Tragic 3.7% |
| Pennsylvania Germans | 0.0 /100 | #301 | Tragic 3.7% |
| Dutch | 0.0 /100 | #302 | Tragic 3.7% |
| Menominee | 0.0 /100 | #303 | Tragic 3.7% |
| French | 0.0 /100 | #304 | Tragic 3.8% |
| English | 0.0 /100 | #305 | Tragic 3.8% |
| Marshallese | 0.0 /100 | #306 | Tragic 3.8% |
| French Canadians | 0.0 /100 | #307 | Tragic 3.8% |
| Ottawa | 0.0 /100 | #308 | Tragic 3.8% |
| Scotch-Irish | 0.0 /100 | #309 | Tragic 3.8% |
| Cree | 0.0 /100 | #310 | Tragic 3.8% |
| Americans | 0.0 /100 | #311 | Tragic 3.9% |
| Cajuns | 0.0 /100 | #312 | Tragic 3.9% |