Immigrants from Southern Europe vs English Hearing Disability
COMPARE
Immigrants from Southern Europe
English
Hearing Disability
Hearing Disability Comparison
Immigrants from Southern Europe
English
3.0%
HEARING DISABILITY
35.3/ 100
METRIC RATING
185th/ 347
METRIC RANK
3.8%
HEARING DISABILITY
0.0/ 100
METRIC RATING
305th/ 347
METRIC RANK
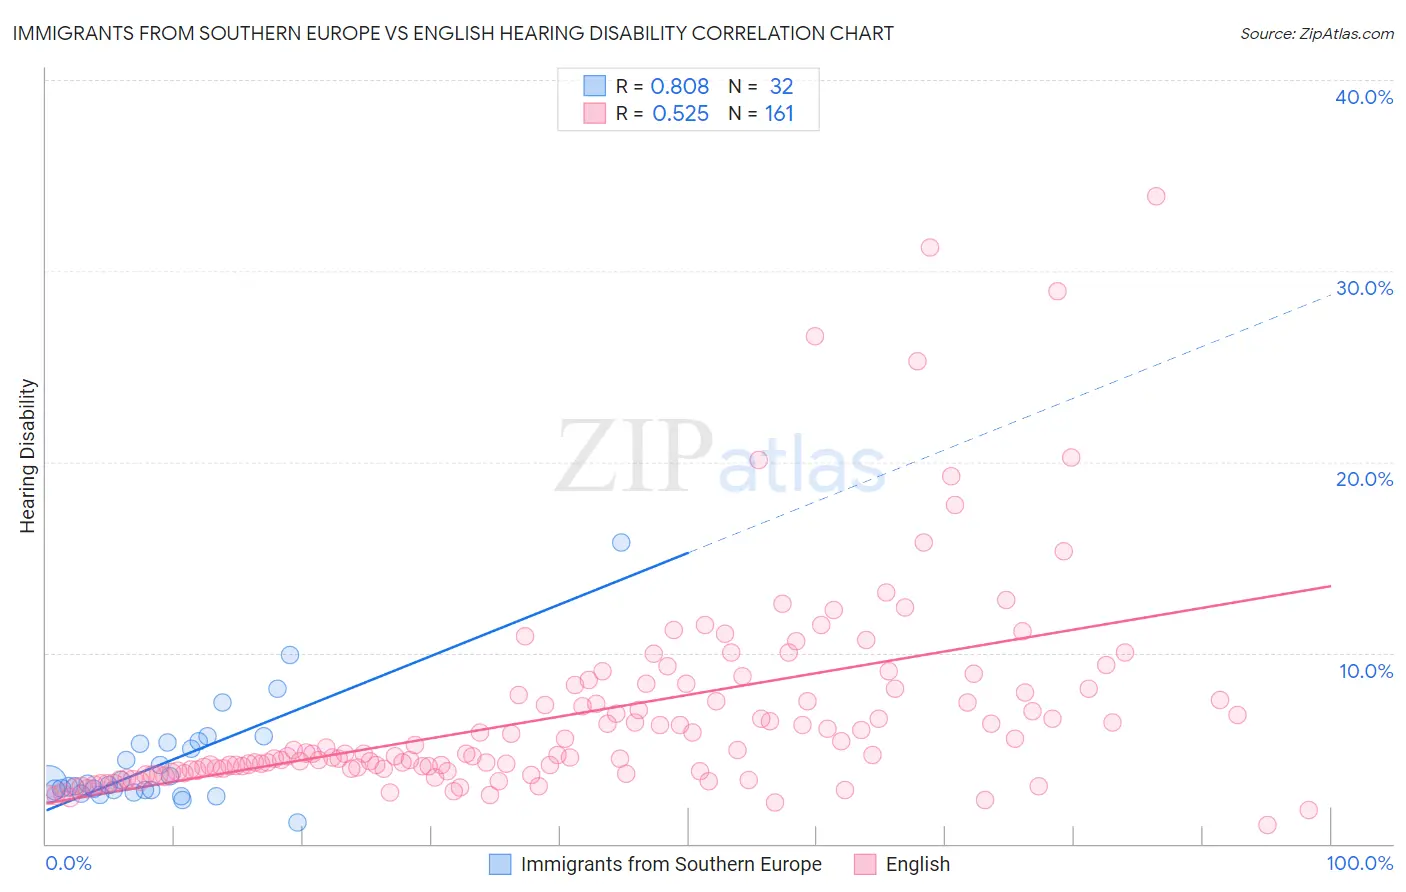
Immigrants from Southern Europe vs English Hearing Disability Correlation Chart
The statistical analysis conducted on geographies consisting of 402,653,873 people shows a very strong positive correlation between the proportion of Immigrants from Southern Europe and percentage of population with hearing disability in the United States with a correlation coefficient (R) of 0.808 and weighted average of 3.0%. Similarly, the statistical analysis conducted on geographies consisting of 578,898,364 people shows a substantial positive correlation between the proportion of English and percentage of population with hearing disability in the United States with a correlation coefficient (R) of 0.525 and weighted average of 3.8%, a difference of 24.3%.
Hearing Disability Correlation Summary
| Measurement | Immigrants from Southern Europe | English |
| Minimum | 1.1% | 1.0% |
| Maximum | 15.8% | 33.9% |
| Range | 14.7% | 32.9% |
| Mean | 4.3% | 6.8% |
| Median | 3.1% | 4.7% |
| Interquartile 25% (IQ1) | 2.8% | 3.8% |
| Interquartile 75% (IQ3) | 5.3% | 8.0% |
| Interquartile Range (IQR) | 2.4% | 4.2% |
| Standard Deviation (Sample) | 2.8% | 5.4% |
| Standard Deviation (Population) | 2.8% | 5.4% |
Similar Demographics by Hearing Disability
Demographics Similar to Immigrants from Southern Europe by Hearing Disability
In terms of hearing disability, the demographic groups most similar to Immigrants from Southern Europe are Immigrants from Mexico (3.0%, a difference of 0.050%), Black/African American (3.0%, a difference of 0.060%), Mexican American Indian (3.0%, a difference of 0.070%), Immigrants from Ireland (3.0%, a difference of 0.21%), and African (3.0%, a difference of 0.25%).
| Demographics | Rating | Rank | Hearing Disability |
| Japanese | 46.0 /100 | #178 | Average 3.0% |
| Immigrants | Moldova | 43.1 /100 | #179 | Average 3.0% |
| Immigrants | Sweden | 42.4 /100 | #180 | Average 3.0% |
| Immigrants | Belgium | 41.5 /100 | #181 | Average 3.0% |
| Immigrants | Italy | 41.1 /100 | #182 | Average 3.0% |
| Bulgarians | 39.7 /100 | #183 | Fair 3.0% |
| Immigrants | Ireland | 37.4 /100 | #184 | Fair 3.0% |
| Immigrants | Southern Europe | 35.3 /100 | #185 | Fair 3.0% |
| Immigrants | Mexico | 34.9 /100 | #186 | Fair 3.0% |
| Blacks/African Americans | 34.7 /100 | #187 | Fair 3.0% |
| Mexican American Indians | 34.7 /100 | #188 | Fair 3.0% |
| Africans | 32.9 /100 | #189 | Fair 3.0% |
| Immigrants | South Africa | 31.1 /100 | #190 | Fair 3.1% |
| Immigrants | Switzerland | 28.8 /100 | #191 | Fair 3.1% |
| Koreans | 27.6 /100 | #192 | Fair 3.1% |
Demographics Similar to English by Hearing Disability
In terms of hearing disability, the demographic groups most similar to English are French (3.8%, a difference of 0.57%), Marshallese (3.8%, a difference of 0.86%), Menominee (3.7%, a difference of 0.87%), Dutch (3.7%, a difference of 0.93%), and French Canadian (3.8%, a difference of 0.98%).
| Demographics | Rating | Rank | Hearing Disability |
| Celtics | 0.0 /100 | #298 | Tragic 3.7% |
| Germans | 0.0 /100 | #299 | Tragic 3.7% |
| Scottish | 0.0 /100 | #300 | Tragic 3.7% |
| Pennsylvania Germans | 0.0 /100 | #301 | Tragic 3.7% |
| Dutch | 0.0 /100 | #302 | Tragic 3.7% |
| Menominee | 0.0 /100 | #303 | Tragic 3.7% |
| French | 0.0 /100 | #304 | Tragic 3.8% |
| English | 0.0 /100 | #305 | Tragic 3.8% |
| Marshallese | 0.0 /100 | #306 | Tragic 3.8% |
| French Canadians | 0.0 /100 | #307 | Tragic 3.8% |
| Ottawa | 0.0 /100 | #308 | Tragic 3.8% |
| Scotch-Irish | 0.0 /100 | #309 | Tragic 3.8% |
| Cree | 0.0 /100 | #310 | Tragic 3.8% |
| Americans | 0.0 /100 | #311 | Tragic 3.9% |
| Cajuns | 0.0 /100 | #312 | Tragic 3.9% |