Czech vs Immigrants from England Disability Age 65 to 74
COMPARE
Czech
Immigrants from England
Disability Age 65 to 74
Disability Age 65 to 74 Comparison
Czechs
Immigrants from England
22.4%
DISABILITY AGE 65 TO 74
93.5/ 100
METRIC RATING
121st/ 347
METRIC RANK
22.2%
DISABILITY AGE 65 TO 74
96.5/ 100
METRIC RATING
101st/ 347
METRIC RANK
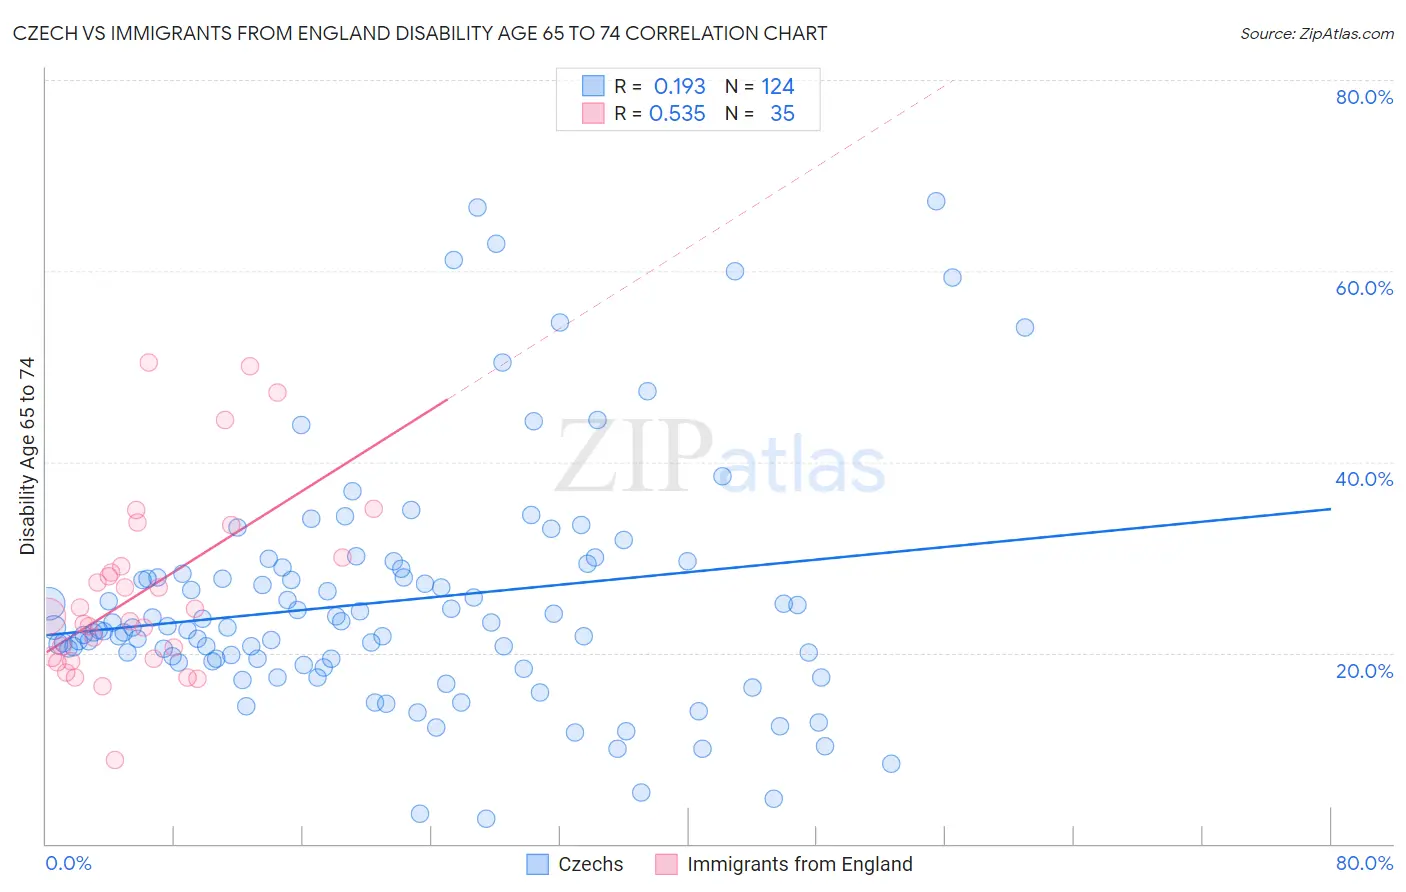
Czech vs Immigrants from England Disability Age 65 to 74 Correlation Chart
The statistical analysis conducted on geographies consisting of 483,519,300 people shows a poor positive correlation between the proportion of Czechs and percentage of population with a disability between the ages 65 and 75 in the United States with a correlation coefficient (R) of 0.193 and weighted average of 22.4%. Similarly, the statistical analysis conducted on geographies consisting of 391,407,764 people shows a substantial positive correlation between the proportion of Immigrants from England and percentage of population with a disability between the ages 65 and 75 in the United States with a correlation coefficient (R) of 0.535 and weighted average of 22.2%, a difference of 0.99%.
Disability Age 65 to 74 Correlation Summary
| Measurement | Czech | Immigrants from England |
| Minimum | 2.7% | 8.8% |
| Maximum | 67.3% | 50.5% |
| Range | 64.7% | 41.7% |
| Mean | 25.4% | 26.5% |
| Median | 22.6% | 23.9% |
| Interquartile 25% (IQ1) | 19.3% | 19.4% |
| Interquartile 75% (IQ3) | 28.6% | 30.0% |
| Interquartile Range (IQR) | 9.3% | 10.6% |
| Standard Deviation (Sample) | 12.5% | 9.8% |
| Standard Deviation (Population) | 12.4% | 9.6% |
Demographics Similar to Czechs and Immigrants from England by Disability Age 65 to 74
In terms of disability age 65 to 74, the demographic groups most similar to Czechs are Immigrants from Kazakhstan (22.4%, a difference of 0.10%), Immigrants from Northern Africa (22.4%, a difference of 0.32%), Swedish (22.4%, a difference of 0.33%), Austrian (22.4%, a difference of 0.33%), and Brazilian (22.4%, a difference of 0.35%). Similarly, the demographic groups most similar to Immigrants from England are Immigrants from Saudi Arabia (22.2%, a difference of 0.020%), South American (22.2%, a difference of 0.050%), Colombian (22.2%, a difference of 0.060%), Palestinian (22.2%, a difference of 0.10%), and Peruvian (22.2%, a difference of 0.16%).
| Demographics | Rating | Rank | Disability Age 65 to 74 |
| Immigrants | England | 96.5 /100 | #101 | Exceptional 22.2% |
| Immigrants | Saudi Arabia | 96.4 /100 | #102 | Exceptional 22.2% |
| South Americans | 96.4 /100 | #103 | Exceptional 22.2% |
| Colombians | 96.4 /100 | #104 | Exceptional 22.2% |
| Palestinians | 96.3 /100 | #105 | Exceptional 22.2% |
| Peruvians | 96.1 /100 | #106 | Exceptional 22.2% |
| Slovenes | 96.1 /100 | #107 | Exceptional 22.2% |
| Immigrants | Zimbabwe | 96.1 /100 | #108 | Exceptional 22.3% |
| Albanians | 95.8 /100 | #109 | Exceptional 22.3% |
| Immigrants | Peru | 95.7 /100 | #110 | Exceptional 22.3% |
| Serbians | 95.7 /100 | #111 | Exceptional 22.3% |
| Immigrants | South America | 95.5 /100 | #112 | Exceptional 22.3% |
| Syrians | 95.3 /100 | #113 | Exceptional 22.3% |
| Ukrainians | 95.1 /100 | #114 | Exceptional 22.3% |
| Laotians | 94.9 /100 | #115 | Exceptional 22.3% |
| Brazilians | 94.8 /100 | #116 | Exceptional 22.4% |
| Swedes | 94.7 /100 | #117 | Exceptional 22.4% |
| Austrians | 94.7 /100 | #118 | Exceptional 22.4% |
| Immigrants | Northern Africa | 94.7 /100 | #119 | Exceptional 22.4% |
| Immigrants | Kazakhstan | 93.9 /100 | #120 | Exceptional 22.4% |
| Czechs | 93.5 /100 | #121 | Exceptional 22.4% |