Czech vs Immigrants from Serbia Disability Age 65 to 74
COMPARE
Czech
Immigrants from Serbia
Disability Age 65 to 74
Disability Age 65 to 74 Comparison
Czechs
Immigrants from Serbia
22.4%
DISABILITY AGE 65 TO 74
93.5/ 100
METRIC RATING
121st/ 347
METRIC RANK
21.4%
DISABILITY AGE 65 TO 74
99.6/ 100
METRIC RATING
51st/ 347
METRIC RANK
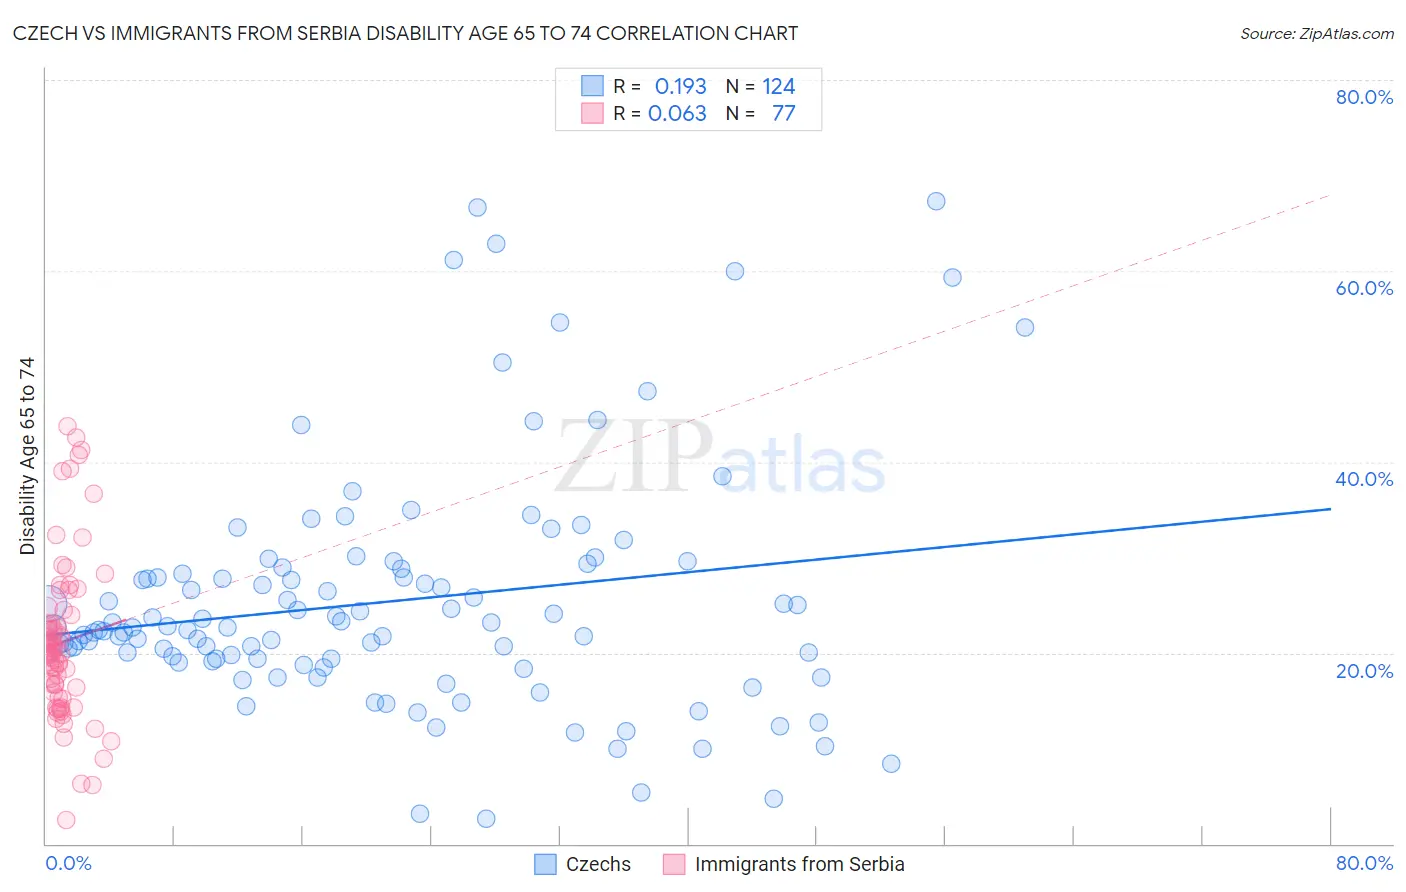
Czech vs Immigrants from Serbia Disability Age 65 to 74 Correlation Chart
The statistical analysis conducted on geographies consisting of 483,519,300 people shows a poor positive correlation between the proportion of Czechs and percentage of population with a disability between the ages 65 and 75 in the United States with a correlation coefficient (R) of 0.193 and weighted average of 22.4%. Similarly, the statistical analysis conducted on geographies consisting of 131,669,066 people shows a slight positive correlation between the proportion of Immigrants from Serbia and percentage of population with a disability between the ages 65 and 75 in the United States with a correlation coefficient (R) of 0.063 and weighted average of 21.4%, a difference of 4.6%.
Disability Age 65 to 74 Correlation Summary
| Measurement | Czech | Immigrants from Serbia |
| Minimum | 2.7% | 2.5% |
| Maximum | 67.3% | 43.7% |
| Range | 64.7% | 41.3% |
| Mean | 25.4% | 21.1% |
| Median | 22.6% | 20.0% |
| Interquartile 25% (IQ1) | 19.3% | 15.6% |
| Interquartile 75% (IQ3) | 28.6% | 24.2% |
| Interquartile Range (IQR) | 9.3% | 8.6% |
| Standard Deviation (Sample) | 12.5% | 8.4% |
| Standard Deviation (Population) | 12.4% | 8.3% |
Similar Demographics by Disability Age 65 to 74
Demographics Similar to Czechs by Disability Age 65 to 74
In terms of disability age 65 to 74, the demographic groups most similar to Czechs are Immigrants from Jordan (22.4%, a difference of 0.0%), Hungarian (22.4%, a difference of 0.050%), Immigrants from Kazakhstan (22.4%, a difference of 0.10%), Norwegian (22.5%, a difference of 0.24%), and Immigrants from Western Europe (22.5%, a difference of 0.28%).
| Demographics | Rating | Rank | Disability Age 65 to 74 |
| Ukrainians | 95.1 /100 | #114 | Exceptional 22.3% |
| Laotians | 94.9 /100 | #115 | Exceptional 22.3% |
| Brazilians | 94.8 /100 | #116 | Exceptional 22.4% |
| Swedes | 94.7 /100 | #117 | Exceptional 22.4% |
| Austrians | 94.7 /100 | #118 | Exceptional 22.4% |
| Immigrants | Northern Africa | 94.7 /100 | #119 | Exceptional 22.4% |
| Immigrants | Kazakhstan | 93.9 /100 | #120 | Exceptional 22.4% |
| Czechs | 93.5 /100 | #121 | Exceptional 22.4% |
| Immigrants | Jordan | 93.5 /100 | #122 | Exceptional 22.4% |
| Hungarians | 93.3 /100 | #123 | Exceptional 22.4% |
| Norwegians | 92.5 /100 | #124 | Exceptional 22.5% |
| Immigrants | Western Europe | 92.3 /100 | #125 | Exceptional 22.5% |
| Lebanese | 92.2 /100 | #126 | Exceptional 22.5% |
| Slovaks | 91.6 /100 | #127 | Exceptional 22.5% |
| Immigrants | Costa Rica | 90.4 /100 | #128 | Exceptional 22.6% |
Demographics Similar to Immigrants from Serbia by Disability Age 65 to 74
In terms of disability age 65 to 74, the demographic groups most similar to Immigrants from Serbia are Immigrants from Malaysia (21.4%, a difference of 0.22%), Immigrants from France (21.5%, a difference of 0.22%), Bhutanese (21.5%, a difference of 0.23%), Immigrants from Italy (21.5%, a difference of 0.24%), and Luxembourger (21.4%, a difference of 0.25%).
| Demographics | Rating | Rank | Disability Age 65 to 74 |
| Estonians | 99.7 /100 | #44 | Exceptional 21.4% |
| Asians | 99.7 /100 | #45 | Exceptional 21.4% |
| Immigrants | Turkey | 99.7 /100 | #46 | Exceptional 21.4% |
| Immigrants | Bulgaria | 99.7 /100 | #47 | Exceptional 21.4% |
| Lithuanians | 99.7 /100 | #48 | Exceptional 21.4% |
| Luxembourgers | 99.7 /100 | #49 | Exceptional 21.4% |
| Immigrants | Malaysia | 99.7 /100 | #50 | Exceptional 21.4% |
| Immigrants | Serbia | 99.6 /100 | #51 | Exceptional 21.4% |
| Immigrants | France | 99.6 /100 | #52 | Exceptional 21.5% |
| Bhutanese | 99.6 /100 | #53 | Exceptional 21.5% |
| Immigrants | Italy | 99.6 /100 | #54 | Exceptional 21.5% |
| Immigrants | Romania | 99.5 /100 | #55 | Exceptional 21.5% |
| Immigrants | Denmark | 99.5 /100 | #56 | Exceptional 21.5% |
| Immigrants | Asia | 99.5 /100 | #57 | Exceptional 21.5% |
| Immigrants | Pakistan | 99.5 /100 | #58 | Exceptional 21.5% |