Czech vs Immigrants from Israel Median Female Earnings
COMPARE
Czech
Immigrants from Israel
Median Female Earnings
Median Female Earnings Comparison
Czechs
Immigrants from Israel
$38,992
MEDIAN FEMALE EARNINGS
18.7/ 100
METRIC RATING
203rd/ 347
METRIC RANK
$46,902
MEDIAN FEMALE EARNINGS
100.0/ 100
METRIC RATING
12th/ 347
METRIC RANK
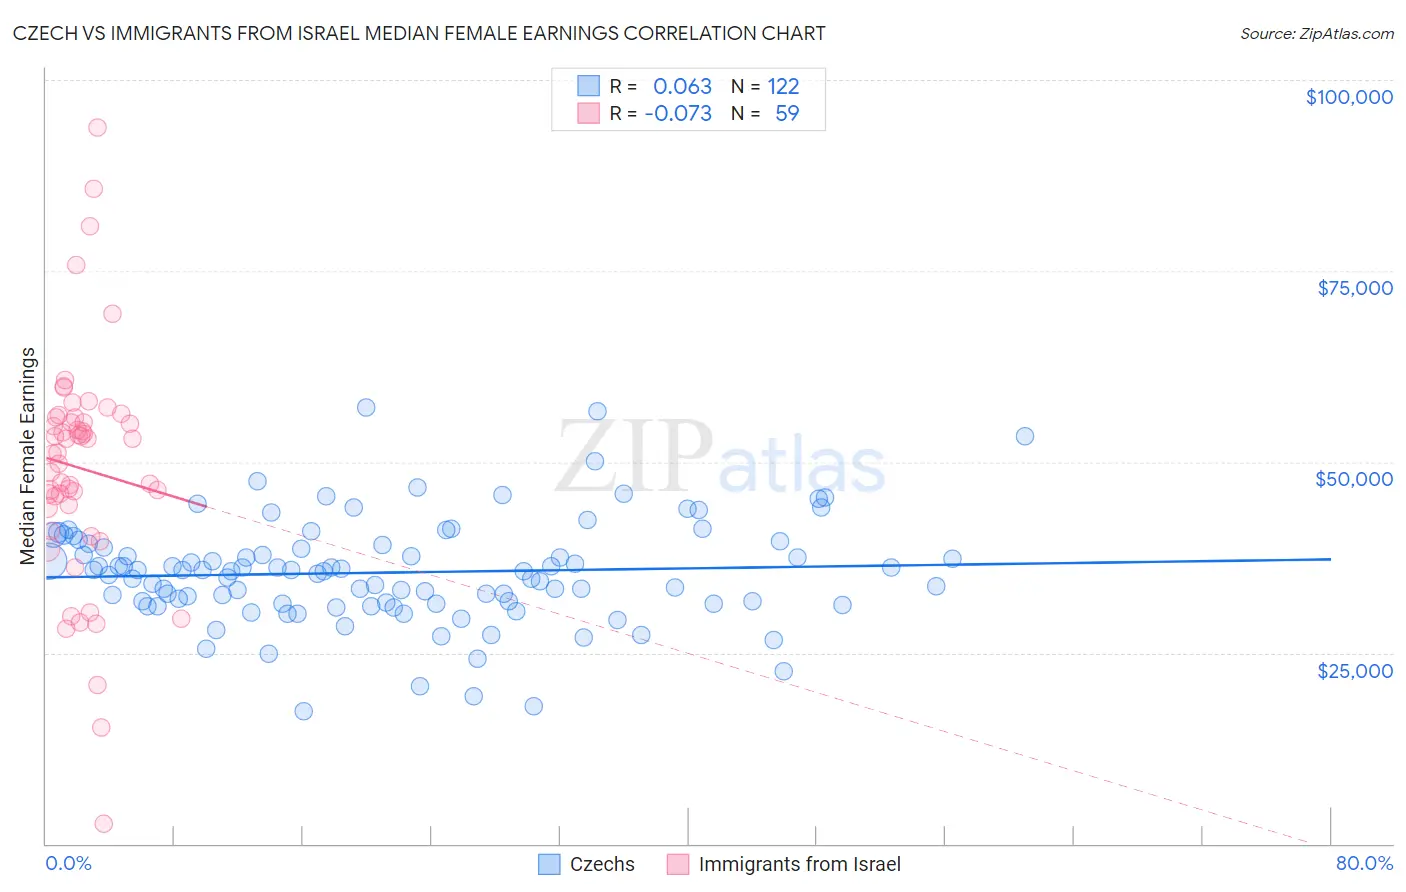
Czech vs Immigrants from Israel Median Female Earnings Correlation Chart
The statistical analysis conducted on geographies consisting of 484,306,761 people shows a slight positive correlation between the proportion of Czechs and median female earnings in the United States with a correlation coefficient (R) of 0.063 and weighted average of $38,992. Similarly, the statistical analysis conducted on geographies consisting of 209,992,905 people shows a slight negative correlation between the proportion of Immigrants from Israel and median female earnings in the United States with a correlation coefficient (R) of -0.073 and weighted average of $46,902, a difference of 20.3%.
Median Female Earnings Correlation Summary
| Measurement | Czech | Immigrants from Israel |
| Minimum | $17,404 | $2,606 |
| Maximum | $57,188 | $93,787 |
| Range | $39,784 | $91,181 |
| Mean | $35,507 | $49,152 |
| Median | $35,690 | $51,157 |
| Interquartile 25% (IQ1) | $31,400 | $44,051 |
| Interquartile 75% (IQ3) | $39,083 | $55,815 |
| Interquartile Range (IQR) | $7,683 | $11,764 |
| Standard Deviation (Sample) | $6,872 | $15,373 |
| Standard Deviation (Population) | $6,843 | $15,242 |
Similar Demographics by Median Female Earnings
Demographics Similar to Czechs by Median Female Earnings
In terms of median female earnings, the demographic groups most similar to Czechs are Slovak ($39,029, a difference of 0.090%), Immigrants from Uruguay ($38,945, a difference of 0.12%), Immigrants from Panama ($39,049, a difference of 0.15%), Panamanian ($39,049, a difference of 0.15%), and Immigrants from Colombia ($38,913, a difference of 0.20%).
| Demographics | Rating | Rank | Median Female Earnings |
| Immigrants | Costa Rica | 25.6 /100 | #196 | Fair $39,186 |
| Assyrians/Chaldeans/Syriacs | 24.6 /100 | #197 | Fair $39,159 |
| Ecuadorians | 23.0 /100 | #198 | Fair $39,117 |
| Icelanders | 22.7 /100 | #199 | Fair $39,109 |
| Immigrants | Panama | 20.6 /100 | #200 | Fair $39,049 |
| Panamanians | 20.6 /100 | #201 | Fair $39,049 |
| Slovaks | 19.9 /100 | #202 | Poor $39,029 |
| Czechs | 18.7 /100 | #203 | Poor $38,992 |
| Immigrants | Uruguay | 17.3 /100 | #204 | Poor $38,945 |
| Immigrants | Colombia | 16.3 /100 | #205 | Poor $38,913 |
| Immigrants | Bosnia and Herzegovina | 15.6 /100 | #206 | Poor $38,886 |
| Immigrants | Cambodia | 14.2 /100 | #207 | Poor $38,833 |
| Immigrants | Thailand | 13.6 /100 | #208 | Poor $38,810 |
| Norwegians | 13.4 /100 | #209 | Poor $38,802 |
| Czechoslovakians | 12.0 /100 | #210 | Poor $38,738 |
Demographics Similar to Immigrants from Israel by Median Female Earnings
In terms of median female earnings, the demographic groups most similar to Immigrants from Israel are Okinawan ($46,905, a difference of 0.010%), Immigrants from China ($46,972, a difference of 0.15%), Immigrants from Iran ($47,154, a difference of 0.54%), Immigrants from Australia ($46,573, a difference of 0.71%), and Soviet Union ($46,556, a difference of 0.74%).
| Demographics | Rating | Rank | Median Female Earnings |
| Immigrants | Singapore | 100.0 /100 | #5 | Exceptional $47,986 |
| Immigrants | Ireland | 100.0 /100 | #6 | Exceptional $47,598 |
| Thais | 100.0 /100 | #7 | Exceptional $47,577 |
| Iranians | 100.0 /100 | #8 | Exceptional $47,421 |
| Immigrants | Iran | 100.0 /100 | #9 | Exceptional $47,154 |
| Immigrants | China | 100.0 /100 | #10 | Exceptional $46,972 |
| Okinawans | 100.0 /100 | #11 | Exceptional $46,905 |
| Immigrants | Israel | 100.0 /100 | #12 | Exceptional $46,902 |
| Immigrants | Australia | 100.0 /100 | #13 | Exceptional $46,573 |
| Soviet Union | 100.0 /100 | #14 | Exceptional $46,556 |
| Immigrants | Eastern Asia | 100.0 /100 | #15 | Exceptional $46,502 |
| Indians (Asian) | 100.0 /100 | #16 | Exceptional $46,481 |
| Immigrants | South Central Asia | 100.0 /100 | #17 | Exceptional $46,324 |
| Cypriots | 100.0 /100 | #18 | Exceptional $45,570 |
| Eastern Europeans | 100.0 /100 | #19 | Exceptional $45,385 |