Czech vs Hopi Self-Care Disability
COMPARE
Czech
Hopi
Self-Care Disability
Self-Care Disability Comparison
Czechs
Hopi
2.3%
SELF-CARE DISABILITY
99.8/ 100
METRIC RATING
46th/ 347
METRIC RANK
2.9%
SELF-CARE DISABILITY
0.0/ 100
METRIC RATING
328th/ 347
METRIC RANK
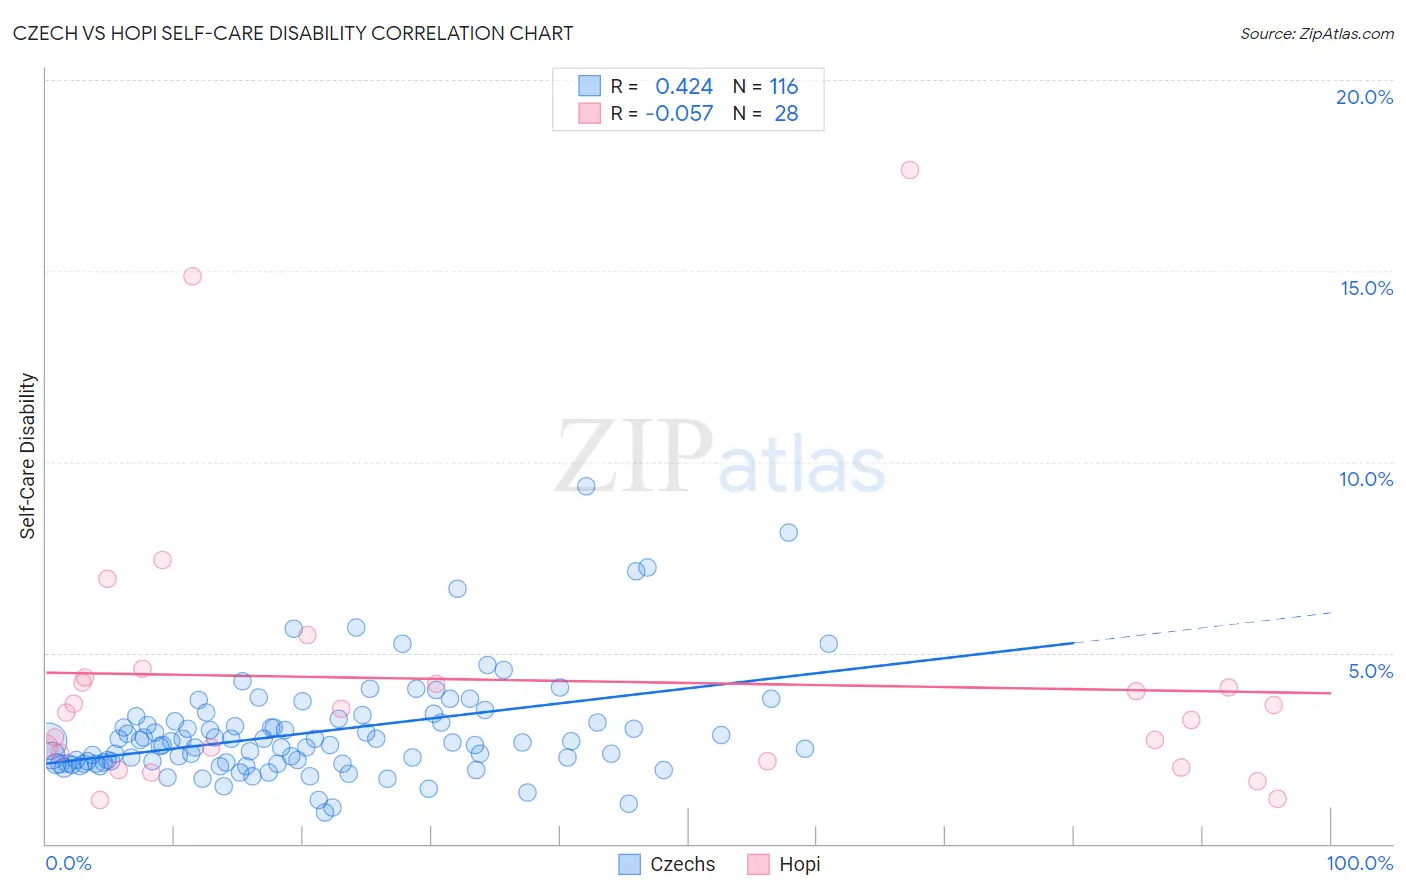
Czech vs Hopi Self-Care Disability Correlation Chart
The statistical analysis conducted on geographies consisting of 483,678,458 people shows a moderate positive correlation between the proportion of Czechs and percentage of population with self-care disability in the United States with a correlation coefficient (R) of 0.424 and weighted average of 2.3%. Similarly, the statistical analysis conducted on geographies consisting of 74,708,657 people shows a slight negative correlation between the proportion of Hopi and percentage of population with self-care disability in the United States with a correlation coefficient (R) of -0.057 and weighted average of 2.9%, a difference of 28.3%.
Self-Care Disability Correlation Summary
| Measurement | Czech | Hopi |
| Minimum | 0.83% | 1.2% |
| Maximum | 9.4% | 17.6% |
| Range | 8.5% | 16.5% |
| Mean | 2.9% | 4.3% |
| Median | 2.6% | 3.5% |
| Interquartile 25% (IQ1) | 2.1% | 2.3% |
| Interquartile 75% (IQ3) | 3.2% | 4.3% |
| Interquartile Range (IQR) | 1.1% | 2.0% |
| Standard Deviation (Sample) | 1.4% | 3.7% |
| Standard Deviation (Population) | 1.4% | 3.7% |
Similar Demographics by Self-Care Disability
Demographics Similar to Czechs by Self-Care Disability
In terms of self-care disability, the demographic groups most similar to Czechs are Norwegian (2.3%, a difference of 0.080%), Immigrants from South Africa (2.3%, a difference of 0.13%), Immigrants from Pakistan (2.3%, a difference of 0.17%), Immigrants from Uganda (2.3%, a difference of 0.22%), and Jordanian (2.3%, a difference of 0.23%).
| Demographics | Rating | Rank | Self-Care Disability |
| Immigrants | Bulgaria | 99.8 /100 | #39 | Exceptional 2.3% |
| Iranians | 99.8 /100 | #40 | Exceptional 2.3% |
| Immigrants | Sudan | 99.8 /100 | #41 | Exceptional 2.3% |
| Immigrants | Uganda | 99.8 /100 | #42 | Exceptional 2.3% |
| Immigrants | Pakistan | 99.8 /100 | #43 | Exceptional 2.3% |
| Immigrants | South Africa | 99.8 /100 | #44 | Exceptional 2.3% |
| Norwegians | 99.8 /100 | #45 | Exceptional 2.3% |
| Czechs | 99.8 /100 | #46 | Exceptional 2.3% |
| Jordanians | 99.7 /100 | #47 | Exceptional 2.3% |
| Immigrants | Malaysia | 99.7 /100 | #48 | Exceptional 2.3% |
| Latvians | 99.7 /100 | #49 | Exceptional 2.3% |
| Immigrants | Brazil | 99.7 /100 | #50 | Exceptional 2.3% |
| Kenyans | 99.7 /100 | #51 | Exceptional 2.3% |
| Immigrants | Serbia | 99.6 /100 | #52 | Exceptional 2.3% |
| Australians | 99.6 /100 | #53 | Exceptional 2.3% |
Demographics Similar to Hopi by Self-Care Disability
In terms of self-care disability, the demographic groups most similar to Hopi are Cajun (2.9%, a difference of 0.21%), Black/African American (2.9%, a difference of 0.39%), Paiute (2.9%, a difference of 0.45%), Nepalese (3.0%, a difference of 0.96%), and Lumbee (3.0%, a difference of 1.1%).
| Demographics | Rating | Rank | Self-Care Disability |
| Navajo | 0.0 /100 | #321 | Tragic 2.9% |
| Comanche | 0.0 /100 | #322 | Tragic 2.9% |
| Seminole | 0.0 /100 | #323 | Tragic 2.9% |
| Cherokee | 0.0 /100 | #324 | Tragic 2.9% |
| Immigrants | Uzbekistan | 0.0 /100 | #325 | Tragic 2.9% |
| Paiute | 0.0 /100 | #326 | Tragic 2.9% |
| Blacks/African Americans | 0.0 /100 | #327 | Tragic 2.9% |
| Hopi | 0.0 /100 | #328 | Tragic 2.9% |
| Cajuns | 0.0 /100 | #329 | Tragic 2.9% |
| Nepalese | 0.0 /100 | #330 | Tragic 3.0% |
| Lumbee | 0.0 /100 | #331 | Tragic 3.0% |
| Kiowa | 0.0 /100 | #332 | Tragic 3.0% |
| Dutch West Indians | 0.0 /100 | #333 | Tragic 3.0% |
| Houma | 0.0 /100 | #334 | Tragic 3.0% |
| Immigrants | Azores | 0.0 /100 | #335 | Tragic 3.0% |