Czechoslovakian vs Immigrants from South Eastern Asia Female Poverty Among 25-34 Year Olds
COMPARE
Czechoslovakian
Immigrants from South Eastern Asia
Female Poverty Among 25-34 Year Olds
Female Poverty Among 25-34 Year Olds Comparison
Czechoslovakians
Immigrants from South Eastern Asia
13.7%
FEMALE POVERTY AMONG 25-34 YEAR OLDS
36.8/ 100
METRIC RATING
184th/ 347
METRIC RANK
12.5%
FEMALE POVERTY AMONG 25-34 YEAR OLDS
97.6/ 100
METRIC RATING
85th/ 347
METRIC RANK
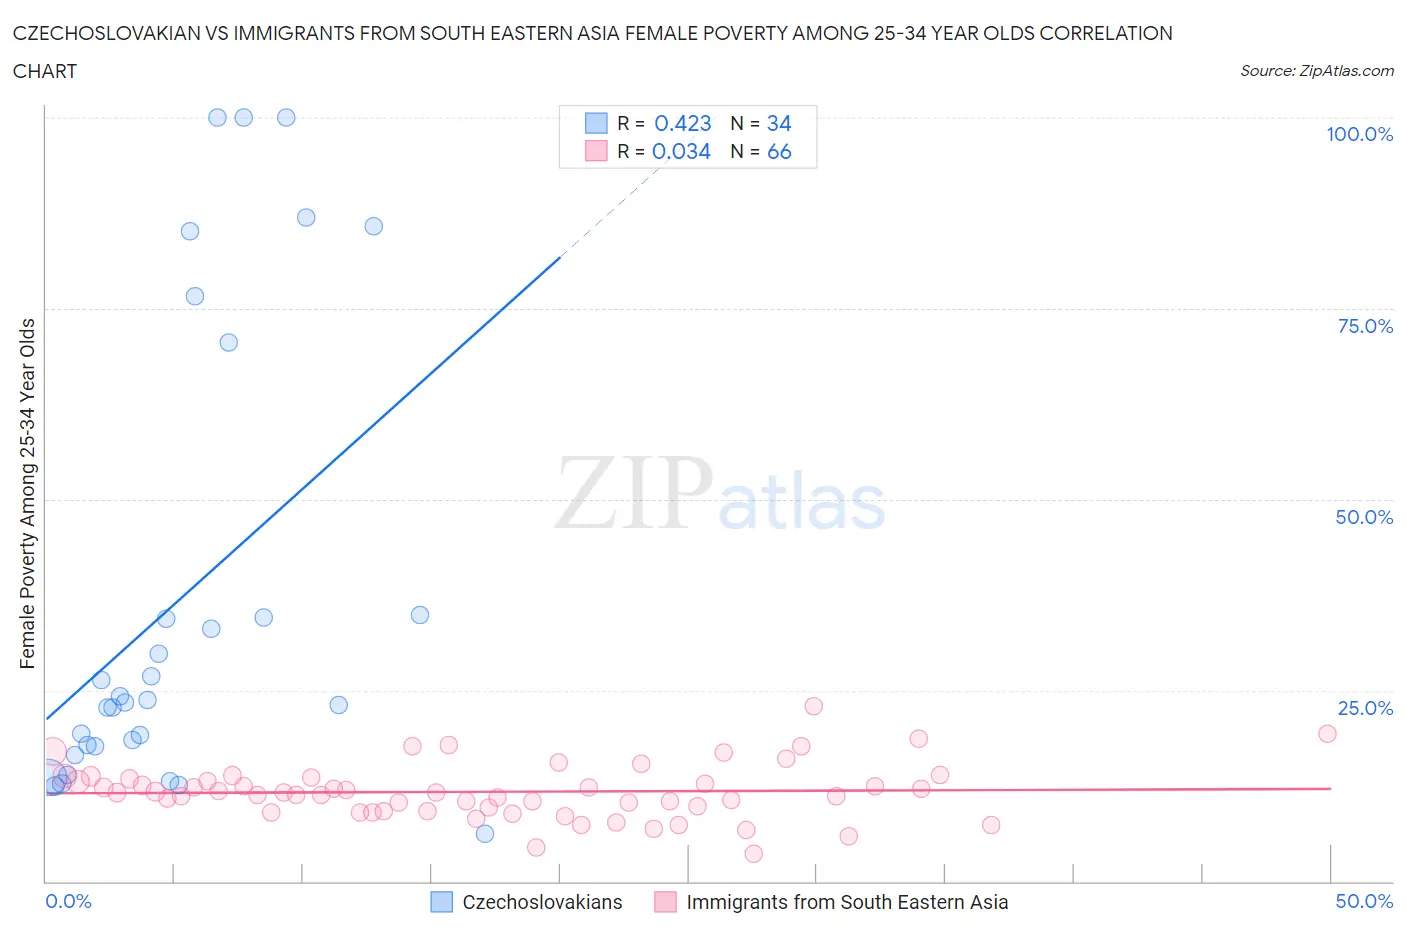
Czechoslovakian vs Immigrants from South Eastern Asia Female Poverty Among 25-34 Year Olds Correlation Chart
The statistical analysis conducted on geographies consisting of 361,442,854 people shows a moderate positive correlation between the proportion of Czechoslovakians and poverty level among females between the ages 25 and 34 in the United States with a correlation coefficient (R) of 0.423 and weighted average of 13.7%. Similarly, the statistical analysis conducted on geographies consisting of 499,745,803 people shows no correlation between the proportion of Immigrants from South Eastern Asia and poverty level among females between the ages 25 and 34 in the United States with a correlation coefficient (R) of 0.034 and weighted average of 12.5%, a difference of 9.5%.
Female Poverty Among 25-34 Year Olds Correlation Summary
| Measurement | Czechoslovakian | Immigrants from South Eastern Asia |
| Minimum | 6.2% | 3.6% |
| Maximum | 100.0% | 23.0% |
| Range | 93.8% | 19.4% |
| Mean | 37.0% | 11.7% |
| Median | 23.6% | 11.6% |
| Interquartile 25% (IQ1) | 17.7% | 9.2% |
| Interquartile 75% (IQ3) | 34.8% | 13.4% |
| Interquartile Range (IQR) | 17.1% | 4.2% |
| Standard Deviation (Sample) | 30.0% | 3.6% |
| Standard Deviation (Population) | 29.6% | 3.6% |
Similar Demographics by Female Poverty Among 25-34 Year Olds
Demographics Similar to Czechoslovakians by Female Poverty Among 25-34 Year Olds
In terms of female poverty among 25-34 year olds, the demographic groups most similar to Czechoslovakians are Irish (13.7%, a difference of 0.13%), Immigrants from Uruguay (13.7%, a difference of 0.24%), Slovak (13.7%, a difference of 0.24%), Portuguese (13.6%, a difference of 0.31%), and Immigrants from Venezuela (13.6%, a difference of 0.34%).
| Demographics | Rating | Rank | Female Poverty Among 25-34 Year Olds |
| Venezuelans | 44.6 /100 | #177 | Average 13.6% |
| Canadians | 44.3 /100 | #178 | Average 13.6% |
| Immigrants | Eastern Africa | 43.6 /100 | #179 | Average 13.6% |
| Germans | 41.6 /100 | #180 | Average 13.6% |
| Guamanians/Chamorros | 41.5 /100 | #181 | Average 13.6% |
| Immigrants | Venezuela | 40.7 /100 | #182 | Average 13.6% |
| Portuguese | 40.3 /100 | #183 | Average 13.6% |
| Czechoslovakians | 36.8 /100 | #184 | Fair 13.7% |
| Irish | 35.3 /100 | #185 | Fair 13.7% |
| Immigrants | Uruguay | 34.1 /100 | #186 | Fair 13.7% |
| Slovaks | 34.1 /100 | #187 | Fair 13.7% |
| Immigrants | Eritrea | 32.7 /100 | #188 | Fair 13.7% |
| Finns | 32.5 /100 | #189 | Fair 13.7% |
| Dutch | 29.7 /100 | #190 | Fair 13.8% |
| Immigrants | St. Vincent and the Grenadines | 29.3 /100 | #191 | Fair 13.8% |
Demographics Similar to Immigrants from South Eastern Asia by Female Poverty Among 25-34 Year Olds
In terms of female poverty among 25-34 year olds, the demographic groups most similar to Immigrants from South Eastern Asia are Croatian (12.5%, a difference of 0.010%), Argentinean (12.5%, a difference of 0.040%), Immigrants from Latvia (12.5%, a difference of 0.11%), Immigrants from Austria (12.5%, a difference of 0.11%), and Albanian (12.5%, a difference of 0.17%).
| Demographics | Rating | Rank | Female Poverty Among 25-34 Year Olds |
| Immigrants | Ukraine | 98.6 /100 | #78 | Exceptional 12.3% |
| Immigrants | Jordan | 98.5 /100 | #79 | Exceptional 12.4% |
| Immigrants | Malaysia | 98.3 /100 | #80 | Exceptional 12.4% |
| Immigrants | Kazakhstan | 98.1 /100 | #81 | Exceptional 12.4% |
| Ethiopians | 98.0 /100 | #82 | Exceptional 12.4% |
| Albanians | 97.7 /100 | #83 | Exceptional 12.5% |
| Immigrants | Latvia | 97.7 /100 | #84 | Exceptional 12.5% |
| Immigrants | South Eastern Asia | 97.6 /100 | #85 | Exceptional 12.5% |
| Croatians | 97.5 /100 | #86 | Exceptional 12.5% |
| Argentineans | 97.5 /100 | #87 | Exceptional 12.5% |
| Immigrants | Austria | 97.4 /100 | #88 | Exceptional 12.5% |
| Italians | 97.2 /100 | #89 | Exceptional 12.5% |
| Immigrants | Albania | 97.1 /100 | #90 | Exceptional 12.5% |
| Norwegians | 96.9 /100 | #91 | Exceptional 12.6% |
| Immigrants | Armenia | 96.9 /100 | #92 | Exceptional 12.6% |