Czechoslovakian vs Immigrants from Micronesia Male Poverty
COMPARE
Czechoslovakian
Immigrants from Micronesia
Male Poverty
Male Poverty Comparison
Czechoslovakians
Immigrants from Micronesia
10.3%
MALE POVERTY
95.6/ 100
METRIC RATING
84th/ 347
METRIC RANK
12.2%
MALE POVERTY
2.1/ 100
METRIC RATING
223rd/ 347
METRIC RANK
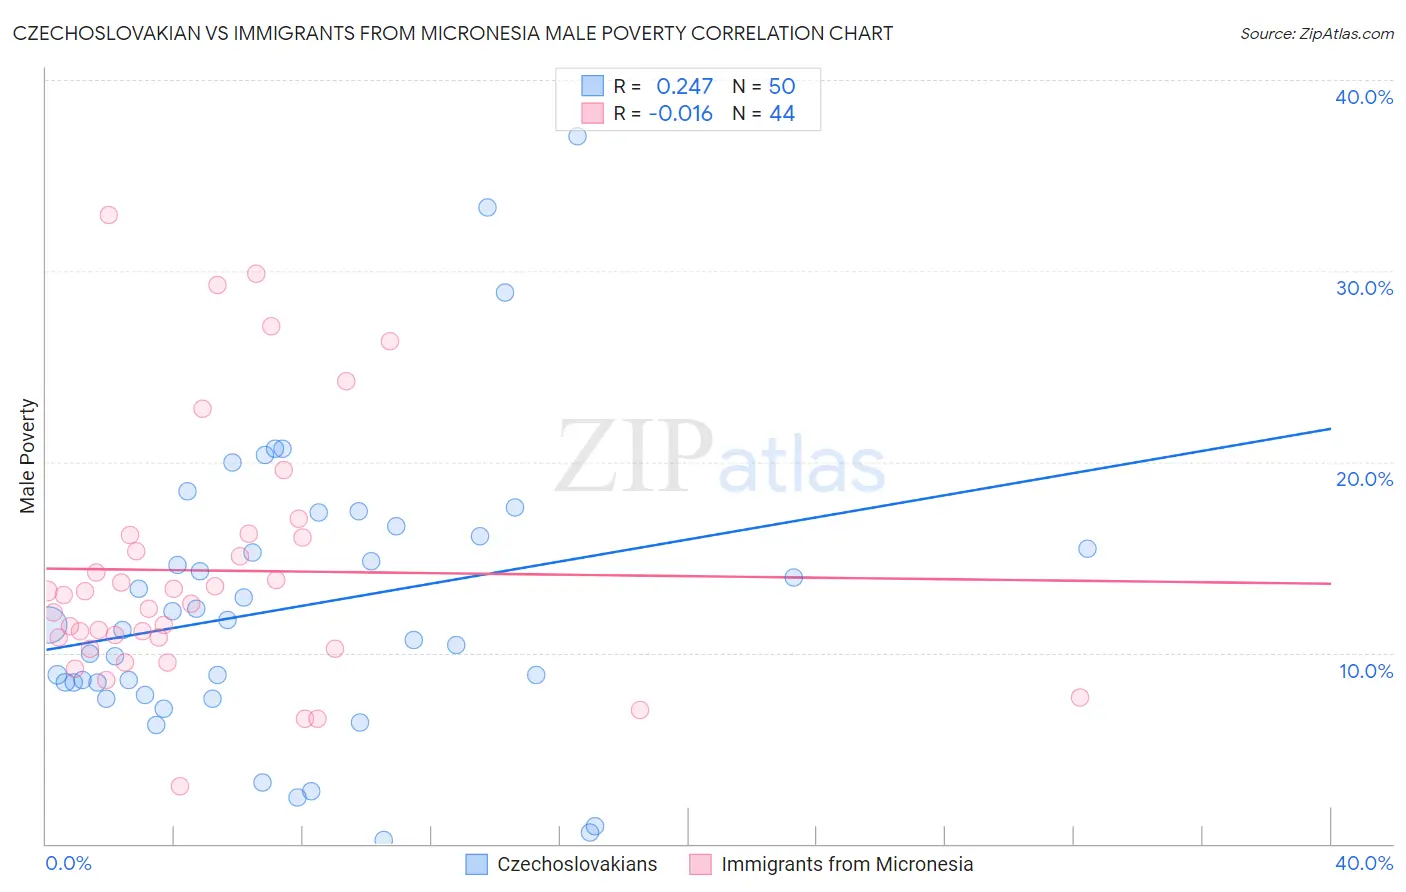
Czechoslovakian vs Immigrants from Micronesia Male Poverty Correlation Chart
The statistical analysis conducted on geographies consisting of 368,409,681 people shows a weak positive correlation between the proportion of Czechoslovakians and poverty level among males in the United States with a correlation coefficient (R) of 0.247 and weighted average of 10.3%. Similarly, the statistical analysis conducted on geographies consisting of 61,601,312 people shows no correlation between the proportion of Immigrants from Micronesia and poverty level among males in the United States with a correlation coefficient (R) of -0.016 and weighted average of 12.2%, a difference of 18.3%.
Male Poverty Correlation Summary
| Measurement | Czechoslovakian | Immigrants from Micronesia |
| Minimum | 0.22% | 3.0% |
| Maximum | 37.0% | 32.9% |
| Range | 36.8% | 29.9% |
| Mean | 12.4% | 14.3% |
| Median | 11.3% | 12.8% |
| Interquartile 25% (IQ1) | 8.4% | 10.5% |
| Interquartile 75% (IQ3) | 16.1% | 16.1% |
| Interquartile Range (IQR) | 7.7% | 5.6% |
| Standard Deviation (Sample) | 7.5% | 6.7% |
| Standard Deviation (Population) | 7.4% | 6.6% |
Similar Demographics by Male Poverty
Demographics Similar to Czechoslovakians by Male Poverty
In terms of male poverty, the demographic groups most similar to Czechoslovakians are Immigrants from England (10.4%, a difference of 0.050%), Immigrants from Sweden (10.3%, a difference of 0.060%), Immigrants from Eastern Asia (10.4%, a difference of 0.18%), Belgian (10.3%, a difference of 0.19%), and Egyptian (10.3%, a difference of 0.19%).
| Demographics | Rating | Rank | Male Poverty |
| Immigrants | Belgium | 96.8 /100 | #77 | Exceptional 10.3% |
| Irish | 96.8 /100 | #78 | Exceptional 10.3% |
| Immigrants | North America | 96.5 /100 | #79 | Exceptional 10.3% |
| English | 96.4 /100 | #80 | Exceptional 10.3% |
| Belgians | 95.9 /100 | #81 | Exceptional 10.3% |
| Egyptians | 95.9 /100 | #82 | Exceptional 10.3% |
| Immigrants | Sweden | 95.7 /100 | #83 | Exceptional 10.3% |
| Czechoslovakians | 95.6 /100 | #84 | Exceptional 10.3% |
| Immigrants | England | 95.5 /100 | #85 | Exceptional 10.4% |
| Immigrants | Eastern Asia | 95.3 /100 | #86 | Exceptional 10.4% |
| Northern Europeans | 95.2 /100 | #87 | Exceptional 10.4% |
| Cambodians | 95.0 /100 | #88 | Exceptional 10.4% |
| Immigrants | Denmark | 95.0 /100 | #89 | Exceptional 10.4% |
| Indians (Asian) | 94.9 /100 | #90 | Exceptional 10.4% |
| British | 94.8 /100 | #91 | Exceptional 10.4% |
Demographics Similar to Immigrants from Micronesia by Male Poverty
In terms of male poverty, the demographic groups most similar to Immigrants from Micronesia are Immigrants from Africa (12.2%, a difference of 0.010%), Ugandan (12.2%, a difference of 0.040%), Immigrants from Eritrea (12.2%, a difference of 0.25%), Bermudan (12.2%, a difference of 0.26%), and German Russian (12.2%, a difference of 0.33%).
| Demographics | Rating | Rank | Male Poverty |
| Immigrants | Cambodia | 2.5 /100 | #216 | Tragic 12.2% |
| Immigrants | Thailand | 2.5 /100 | #217 | Tragic 12.2% |
| German Russians | 2.5 /100 | #218 | Tragic 12.2% |
| Bermudans | 2.4 /100 | #219 | Tragic 12.2% |
| Immigrants | Eritrea | 2.4 /100 | #220 | Tragic 12.2% |
| Ugandans | 2.2 /100 | #221 | Tragic 12.2% |
| Immigrants | Africa | 2.1 /100 | #222 | Tragic 12.2% |
| Immigrants | Micronesia | 2.1 /100 | #223 | Tragic 12.2% |
| Immigrants | Nigeria | 1.6 /100 | #224 | Tragic 12.3% |
| Osage | 1.5 /100 | #225 | Tragic 12.3% |
| Nigerians | 1.4 /100 | #226 | Tragic 12.3% |
| Alaska Natives | 1.4 /100 | #227 | Tragic 12.4% |
| Alsatians | 1.3 /100 | #228 | Tragic 12.4% |
| Cubans | 1.3 /100 | #229 | Tragic 12.4% |
| Marshallese | 0.8 /100 | #230 | Tragic 12.5% |