Czechoslovakian vs Immigrants from Syria Disability
COMPARE
Czechoslovakian
Immigrants from Syria
Disability
Disability Comparison
Czechoslovakians
Immigrants from Syria
12.5%
DISABILITY
0.2/ 100
METRIC RATING
266th/ 347
METRIC RANK
11.3%
DISABILITY
94.7/ 100
METRIC RATING
114th/ 347
METRIC RANK
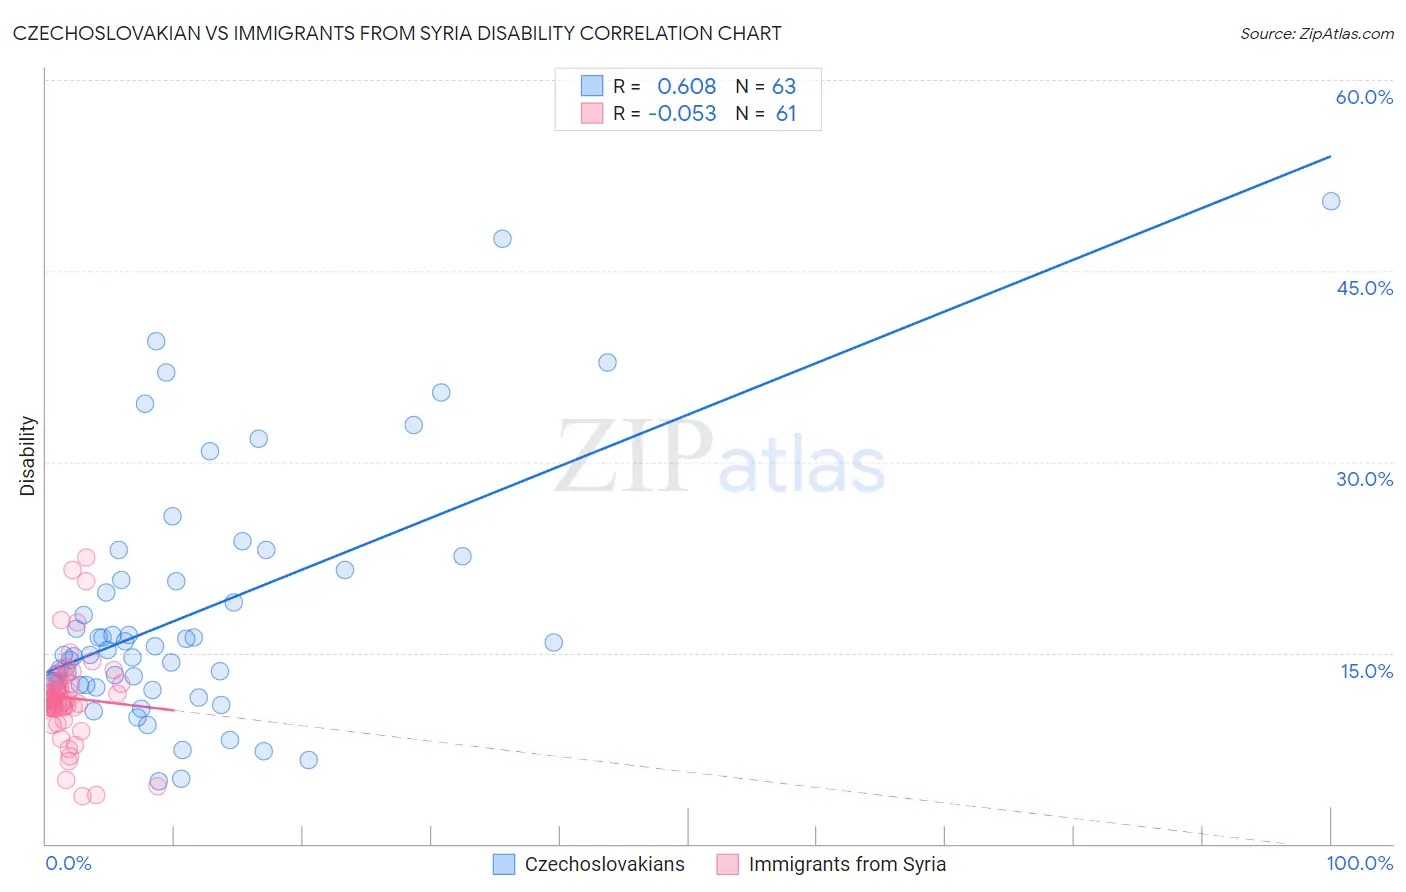
Czechoslovakian vs Immigrants from Syria Disability Correlation Chart
The statistical analysis conducted on geographies consisting of 368,659,957 people shows a significant positive correlation between the proportion of Czechoslovakians and percentage of population with a disability in the United States with a correlation coefficient (R) of 0.608 and weighted average of 12.5%. Similarly, the statistical analysis conducted on geographies consisting of 174,112,595 people shows a slight negative correlation between the proportion of Immigrants from Syria and percentage of population with a disability in the United States with a correlation coefficient (R) of -0.053 and weighted average of 11.3%, a difference of 10.5%.
Disability Correlation Summary
| Measurement | Czechoslovakian | Immigrants from Syria |
| Minimum | 5.0% | 3.7% |
| Maximum | 50.5% | 22.5% |
| Range | 45.5% | 18.8% |
| Mean | 18.3% | 11.5% |
| Median | 15.2% | 11.3% |
| Interquartile 25% (IQ1) | 12.5% | 10.7% |
| Interquartile 75% (IQ3) | 21.6% | 12.6% |
| Interquartile Range (IQR) | 9.0% | 2.0% |
| Standard Deviation (Sample) | 9.9% | 3.5% |
| Standard Deviation (Population) | 9.8% | 3.5% |
Similar Demographics by Disability
Demographics Similar to Czechoslovakians by Disability
In terms of disability, the demographic groups most similar to Czechoslovakians are Spaniard (12.5%, a difference of 0.070%), U.S. Virgin Islander (12.5%, a difference of 0.16%), Immigrants from Germany (12.5%, a difference of 0.18%), Hawaiian (12.5%, a difference of 0.29%), and Bangladeshi (12.6%, a difference of 0.40%).
| Demographics | Rating | Rank | Disability |
| Canadians | 0.4 /100 | #259 | Tragic 12.4% |
| Immigrants | Liberia | 0.4 /100 | #260 | Tragic 12.4% |
| Scandinavians | 0.4 /100 | #261 | Tragic 12.4% |
| Native Hawaiians | 0.3 /100 | #262 | Tragic 12.5% |
| Hawaiians | 0.2 /100 | #263 | Tragic 12.5% |
| Immigrants | Germany | 0.2 /100 | #264 | Tragic 12.5% |
| U.S. Virgin Islanders | 0.2 /100 | #265 | Tragic 12.5% |
| Czechoslovakians | 0.2 /100 | #266 | Tragic 12.5% |
| Spaniards | 0.2 /100 | #267 | Tragic 12.5% |
| Bangladeshis | 0.1 /100 | #268 | Tragic 12.6% |
| Immigrants | Dominican Republic | 0.1 /100 | #269 | Tragic 12.6% |
| Portuguese | 0.1 /100 | #270 | Tragic 12.6% |
| Immigrants | Yemen | 0.1 /100 | #271 | Tragic 12.6% |
| Dominicans | 0.0 /100 | #272 | Tragic 12.7% |
| Finns | 0.0 /100 | #273 | Tragic 12.7% |
Demographics Similar to Immigrants from Syria by Disability
In terms of disability, the demographic groups most similar to Immigrants from Syria are Guyanese (11.3%, a difference of 0.010%), Immigrants from Philippines (11.3%, a difference of 0.010%), Immigrants from Uzbekistan (11.3%, a difference of 0.050%), Immigrants from Northern Europe (11.3%, a difference of 0.13%), and Immigrants from South Eastern Asia (11.3%, a difference of 0.17%).
| Demographics | Rating | Rank | Disability |
| Nicaraguans | 96.2 /100 | #107 | Exceptional 11.3% |
| Immigrants | Nigeria | 96.0 /100 | #108 | Exceptional 11.3% |
| Immigrants | Uganda | 95.7 /100 | #109 | Exceptional 11.3% |
| Immigrants | Denmark | 95.6 /100 | #110 | Exceptional 11.3% |
| Immigrants | South Eastern Asia | 95.4 /100 | #111 | Exceptional 11.3% |
| Immigrants | Uzbekistan | 94.9 /100 | #112 | Exceptional 11.3% |
| Guyanese | 94.7 /100 | #113 | Exceptional 11.3% |
| Immigrants | Syria | 94.7 /100 | #114 | Exceptional 11.3% |
| Immigrants | Philippines | 94.6 /100 | #115 | Exceptional 11.3% |
| Immigrants | Northern Europe | 94.1 /100 | #116 | Exceptional 11.3% |
| Luxembourgers | 93.9 /100 | #117 | Exceptional 11.3% |
| Koreans | 93.8 /100 | #118 | Exceptional 11.3% |
| Central Americans | 93.5 /100 | #119 | Exceptional 11.4% |
| Immigrants | North Macedonia | 93.5 /100 | #120 | Exceptional 11.4% |
| Immigrants | Costa Rica | 93.4 /100 | #121 | Exceptional 11.4% |