Czechoslovakian vs Immigrants from England Disability
COMPARE
Czechoslovakian
Immigrants from England
Disability
Disability Comparison
Czechoslovakians
Immigrants from England
12.5%
DISABILITY
0.2/ 100
METRIC RATING
266th/ 347
METRIC RANK
12.0%
DISABILITY
12.0/ 100
METRIC RATING
202nd/ 347
METRIC RANK
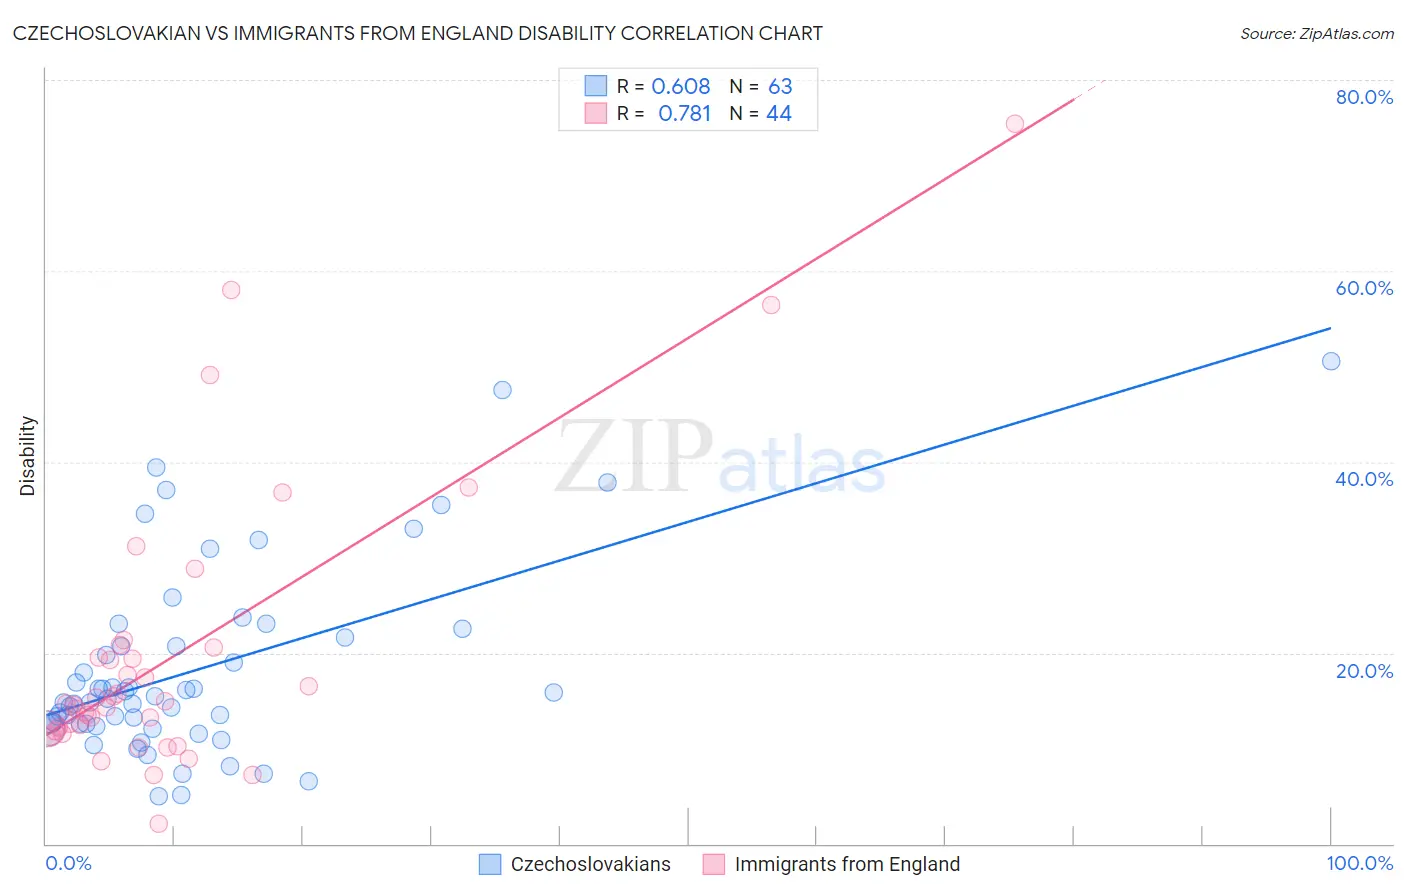
Czechoslovakian vs Immigrants from England Disability Correlation Chart
The statistical analysis conducted on geographies consisting of 368,659,957 people shows a significant positive correlation between the proportion of Czechoslovakians and percentage of population with a disability in the United States with a correlation coefficient (R) of 0.608 and weighted average of 12.5%. Similarly, the statistical analysis conducted on geographies consisting of 391,892,712 people shows a strong positive correlation between the proportion of Immigrants from England and percentage of population with a disability in the United States with a correlation coefficient (R) of 0.781 and weighted average of 12.0%, a difference of 4.6%.
Disability Correlation Summary
| Measurement | Czechoslovakian | Immigrants from England |
| Minimum | 5.0% | 2.1% |
| Maximum | 50.5% | 75.4% |
| Range | 45.5% | 73.3% |
| Mean | 18.3% | 19.7% |
| Median | 15.2% | 14.6% |
| Interquartile 25% (IQ1) | 12.5% | 11.9% |
| Interquartile 75% (IQ3) | 21.6% | 20.1% |
| Interquartile Range (IQR) | 9.0% | 8.1% |
| Standard Deviation (Sample) | 9.9% | 14.9% |
| Standard Deviation (Population) | 9.8% | 14.7% |
Similar Demographics by Disability
Demographics Similar to Czechoslovakians by Disability
In terms of disability, the demographic groups most similar to Czechoslovakians are Spaniard (12.5%, a difference of 0.070%), U.S. Virgin Islander (12.5%, a difference of 0.16%), Immigrants from Germany (12.5%, a difference of 0.18%), Hawaiian (12.5%, a difference of 0.29%), and Bangladeshi (12.6%, a difference of 0.40%).
| Demographics | Rating | Rank | Disability |
| Canadians | 0.4 /100 | #259 | Tragic 12.4% |
| Immigrants | Liberia | 0.4 /100 | #260 | Tragic 12.4% |
| Scandinavians | 0.4 /100 | #261 | Tragic 12.4% |
| Native Hawaiians | 0.3 /100 | #262 | Tragic 12.5% |
| Hawaiians | 0.2 /100 | #263 | Tragic 12.5% |
| Immigrants | Germany | 0.2 /100 | #264 | Tragic 12.5% |
| U.S. Virgin Islanders | 0.2 /100 | #265 | Tragic 12.5% |
| Czechoslovakians | 0.2 /100 | #266 | Tragic 12.5% |
| Spaniards | 0.2 /100 | #267 | Tragic 12.5% |
| Bangladeshis | 0.1 /100 | #268 | Tragic 12.6% |
| Immigrants | Dominican Republic | 0.1 /100 | #269 | Tragic 12.6% |
| Portuguese | 0.1 /100 | #270 | Tragic 12.6% |
| Immigrants | Yemen | 0.1 /100 | #271 | Tragic 12.6% |
| Dominicans | 0.0 /100 | #272 | Tragic 12.7% |
| Finns | 0.0 /100 | #273 | Tragic 12.7% |
Demographics Similar to Immigrants from England by Disability
In terms of disability, the demographic groups most similar to Immigrants from England are British West Indian (12.0%, a difference of 0.050%), Mexican American Indian (12.0%, a difference of 0.050%), Assyrian/Chaldean/Syriac (11.9%, a difference of 0.070%), Belizean (11.9%, a difference of 0.090%), and Immigrants from Western Europe (12.0%, a difference of 0.21%).
| Demographics | Rating | Rank | Disability |
| Barbadians | 15.8 /100 | #195 | Poor 11.9% |
| Serbians | 15.4 /100 | #196 | Poor 11.9% |
| Immigrants | Belize | 15.2 /100 | #197 | Poor 11.9% |
| Ukrainians | 14.7 /100 | #198 | Poor 11.9% |
| Immigrants | Panama | 14.6 /100 | #199 | Poor 11.9% |
| Belizeans | 12.8 /100 | #200 | Poor 11.9% |
| Assyrians/Chaldeans/Syriacs | 12.6 /100 | #201 | Poor 11.9% |
| Immigrants | England | 12.0 /100 | #202 | Poor 12.0% |
| British West Indians | 11.5 /100 | #203 | Poor 12.0% |
| Mexican American Indians | 11.4 /100 | #204 | Poor 12.0% |
| Immigrants | Western Europe | 10.1 /100 | #205 | Poor 12.0% |
| Immigrants | Senegal | 9.4 /100 | #206 | Tragic 12.0% |
| Immigrants | Thailand | 9.3 /100 | #207 | Tragic 12.0% |
| Immigrants | Caribbean | 9.1 /100 | #208 | Tragic 12.0% |
| Danes | 8.7 /100 | #209 | Tragic 12.0% |