Cypriot vs Immigrants from Africa Self-Care Disability
COMPARE
Cypriot
Immigrants from Africa
Self-Care Disability
Self-Care Disability Comparison
Cypriots
Immigrants from Africa
2.2%
SELF-CARE DISABILITY
100.0/ 100
METRIC RATING
24th/ 347
METRIC RANK
2.4%
SELF-CARE DISABILITY
93.7/ 100
METRIC RATING
110th/ 347
METRIC RANK
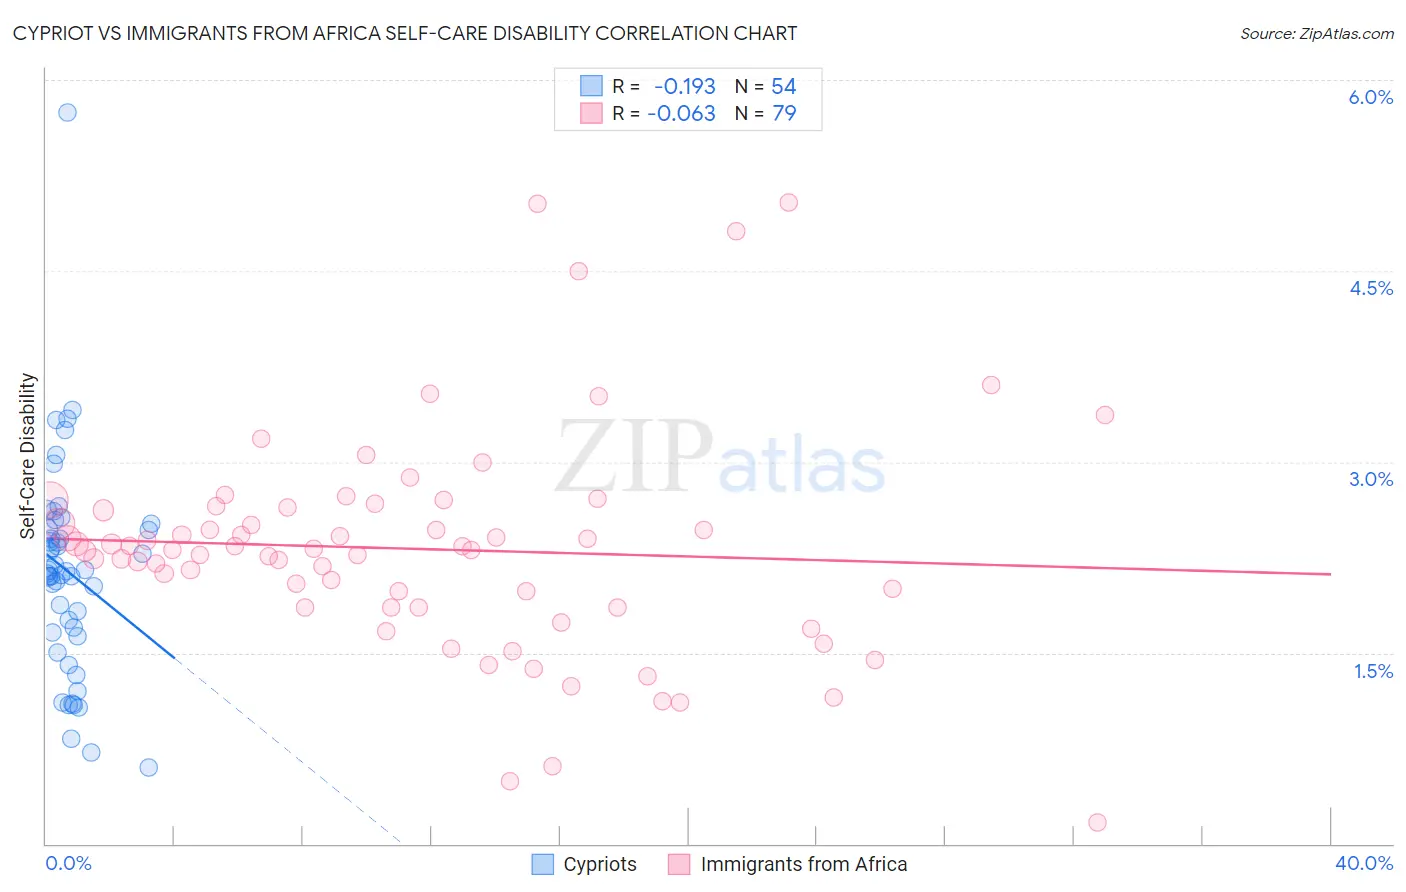
Cypriot vs Immigrants from Africa Self-Care Disability Correlation Chart
The statistical analysis conducted on geographies consisting of 61,833,470 people shows a poor negative correlation between the proportion of Cypriots and percentage of population with self-care disability in the United States with a correlation coefficient (R) of -0.193 and weighted average of 2.2%. Similarly, the statistical analysis conducted on geographies consisting of 468,498,120 people shows a slight negative correlation between the proportion of Immigrants from Africa and percentage of population with self-care disability in the United States with a correlation coefficient (R) of -0.063 and weighted average of 2.4%, a difference of 6.6%.
Self-Care Disability Correlation Summary
| Measurement | Cypriot | Immigrants from Africa |
| Minimum | 0.60% | 0.17% |
| Maximum | 5.7% | 5.0% |
| Range | 5.1% | 4.9% |
| Mean | 2.1% | 2.3% |
| Median | 2.1% | 2.3% |
| Interquartile 25% (IQ1) | 1.7% | 1.9% |
| Interquartile 75% (IQ3) | 2.5% | 2.6% |
| Interquartile Range (IQR) | 0.80% | 0.79% |
| Standard Deviation (Sample) | 0.84% | 0.87% |
| Standard Deviation (Population) | 0.83% | 0.87% |
Similar Demographics by Self-Care Disability
Demographics Similar to Cypriots by Self-Care Disability
In terms of self-care disability, the demographic groups most similar to Cypriots are Turkish (2.2%, a difference of 0.11%), Immigrants from Sri Lanka (2.2%, a difference of 0.18%), Venezuelan (2.2%, a difference of 0.19%), Cambodian (2.2%, a difference of 0.30%), and Inupiat (2.2%, a difference of 0.35%).
| Demographics | Rating | Rank | Self-Care Disability |
| Immigrants | Saudi Arabia | 100.0 /100 | #17 | Exceptional 2.2% |
| Immigrants | Taiwan | 100.0 /100 | #18 | Exceptional 2.2% |
| Immigrants | Eritrea | 100.0 /100 | #19 | Exceptional 2.2% |
| Tongans | 100.0 /100 | #20 | Exceptional 2.2% |
| Bulgarians | 100.0 /100 | #21 | Exceptional 2.2% |
| Immigrants | Venezuela | 100.0 /100 | #22 | Exceptional 2.2% |
| Cambodians | 100.0 /100 | #23 | Exceptional 2.2% |
| Cypriots | 100.0 /100 | #24 | Exceptional 2.2% |
| Turks | 100.0 /100 | #25 | Exceptional 2.2% |
| Immigrants | Sri Lanka | 99.9 /100 | #26 | Exceptional 2.2% |
| Venezuelans | 99.9 /100 | #27 | Exceptional 2.2% |
| Inupiat | 99.9 /100 | #28 | Exceptional 2.2% |
| Immigrants | Zimbabwe | 99.9 /100 | #29 | Exceptional 2.3% |
| Paraguayans | 99.9 /100 | #30 | Exceptional 2.3% |
| Danes | 99.9 /100 | #31 | Exceptional 2.3% |
Demographics Similar to Immigrants from Africa by Self-Care Disability
In terms of self-care disability, the demographic groups most similar to Immigrants from Africa are Serbian (2.4%, a difference of 0.020%), Scandinavian (2.4%, a difference of 0.050%), Slovene (2.4%, a difference of 0.080%), Greek (2.4%, a difference of 0.090%), and South American (2.4%, a difference of 0.11%).
| Demographics | Rating | Rank | Self-Care Disability |
| Alsatians | 94.9 /100 | #103 | Exceptional 2.4% |
| Bhutanese | 94.5 /100 | #104 | Exceptional 2.4% |
| Carpatho Rusyns | 94.4 /100 | #105 | Exceptional 2.4% |
| Immigrants | Indonesia | 94.3 /100 | #106 | Exceptional 2.4% |
| British | 94.3 /100 | #107 | Exceptional 2.4% |
| Greeks | 94.1 /100 | #108 | Exceptional 2.4% |
| Slovenes | 94.1 /100 | #109 | Exceptional 2.4% |
| Immigrants | Africa | 93.7 /100 | #110 | Exceptional 2.4% |
| Serbians | 93.6 /100 | #111 | Exceptional 2.4% |
| Scandinavians | 93.5 /100 | #112 | Exceptional 2.4% |
| South Americans | 93.2 /100 | #113 | Exceptional 2.4% |
| Immigrants | North Macedonia | 93.1 /100 | #114 | Exceptional 2.4% |
| Immigrants | Hong Kong | 93.1 /100 | #115 | Exceptional 2.4% |
| Northern Europeans | 92.9 /100 | #116 | Exceptional 2.4% |
| Taiwanese | 92.5 /100 | #117 | Exceptional 2.4% |