Cypriot vs Jamaican Self-Care Disability
COMPARE
Cypriot
Jamaican
Self-Care Disability
Self-Care Disability Comparison
Cypriots
Jamaicans
2.2%
SELF-CARE DISABILITY
100.0/ 100
METRIC RATING
24th/ 347
METRIC RANK
2.7%
SELF-CARE DISABILITY
0.0/ 100
METRIC RATING
285th/ 347
METRIC RANK
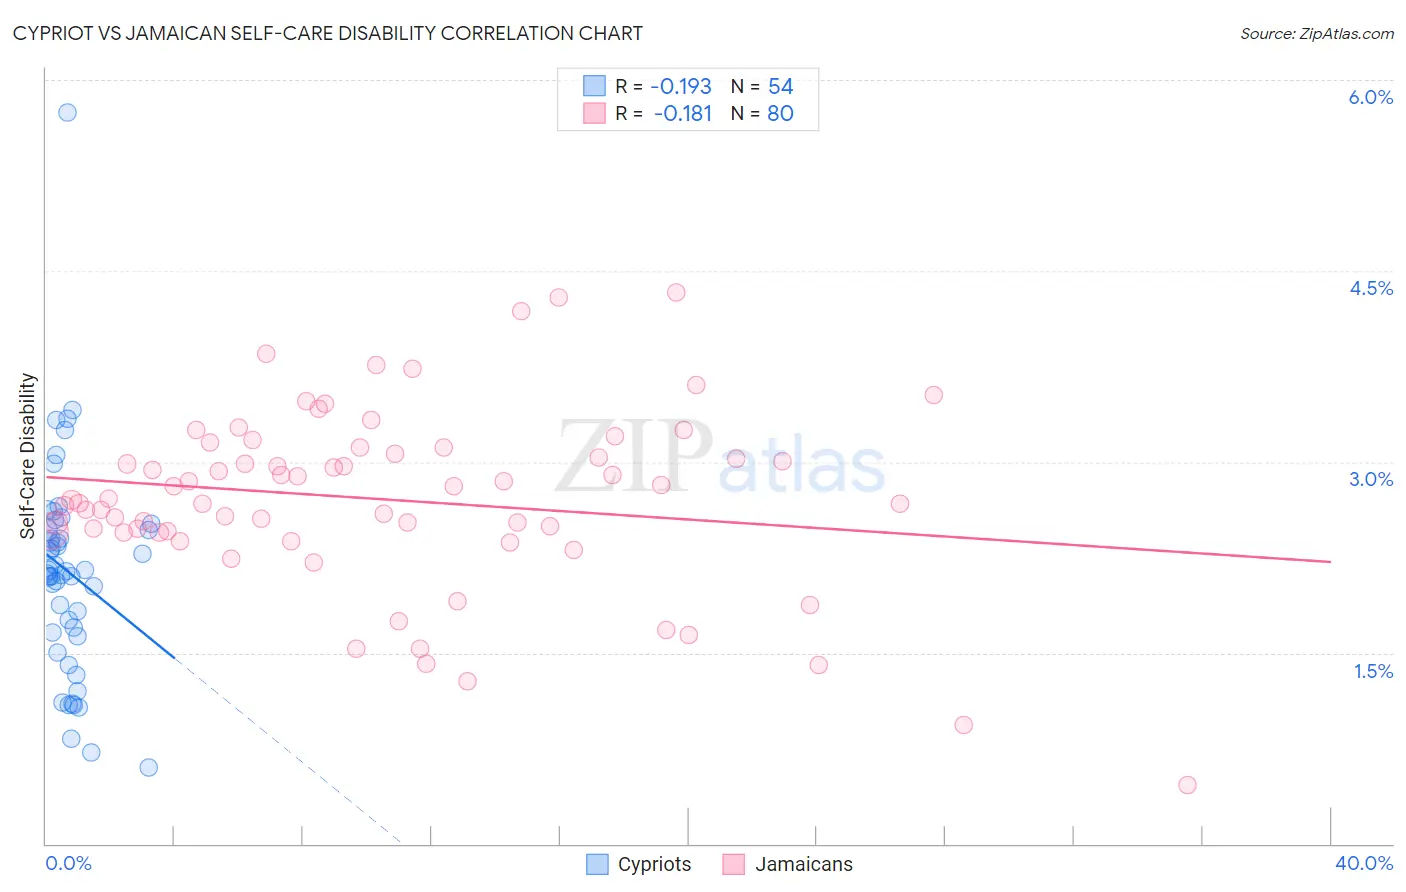
Cypriot vs Jamaican Self-Care Disability Correlation Chart
The statistical analysis conducted on geographies consisting of 61,833,470 people shows a poor negative correlation between the proportion of Cypriots and percentage of population with self-care disability in the United States with a correlation coefficient (R) of -0.193 and weighted average of 2.2%. Similarly, the statistical analysis conducted on geographies consisting of 367,399,867 people shows a poor negative correlation between the proportion of Jamaicans and percentage of population with self-care disability in the United States with a correlation coefficient (R) of -0.181 and weighted average of 2.7%, a difference of 20.4%.
Self-Care Disability Correlation Summary
| Measurement | Cypriot | Jamaican |
| Minimum | 0.60% | 0.47% |
| Maximum | 5.7% | 4.3% |
| Range | 5.1% | 3.9% |
| Mean | 2.1% | 2.7% |
| Median | 2.1% | 2.7% |
| Interquartile 25% (IQ1) | 1.7% | 2.5% |
| Interquartile 75% (IQ3) | 2.5% | 3.1% |
| Interquartile Range (IQR) | 0.80% | 0.64% |
| Standard Deviation (Sample) | 0.84% | 0.71% |
| Standard Deviation (Population) | 0.83% | 0.70% |
Similar Demographics by Self-Care Disability
Demographics Similar to Cypriots by Self-Care Disability
In terms of self-care disability, the demographic groups most similar to Cypriots are Turkish (2.2%, a difference of 0.11%), Immigrants from Sri Lanka (2.2%, a difference of 0.18%), Venezuelan (2.2%, a difference of 0.19%), Cambodian (2.2%, a difference of 0.30%), and Inupiat (2.2%, a difference of 0.35%).
| Demographics | Rating | Rank | Self-Care Disability |
| Immigrants | Saudi Arabia | 100.0 /100 | #17 | Exceptional 2.2% |
| Immigrants | Taiwan | 100.0 /100 | #18 | Exceptional 2.2% |
| Immigrants | Eritrea | 100.0 /100 | #19 | Exceptional 2.2% |
| Tongans | 100.0 /100 | #20 | Exceptional 2.2% |
| Bulgarians | 100.0 /100 | #21 | Exceptional 2.2% |
| Immigrants | Venezuela | 100.0 /100 | #22 | Exceptional 2.2% |
| Cambodians | 100.0 /100 | #23 | Exceptional 2.2% |
| Cypriots | 100.0 /100 | #24 | Exceptional 2.2% |
| Turks | 100.0 /100 | #25 | Exceptional 2.2% |
| Immigrants | Sri Lanka | 99.9 /100 | #26 | Exceptional 2.2% |
| Venezuelans | 99.9 /100 | #27 | Exceptional 2.2% |
| Inupiat | 99.9 /100 | #28 | Exceptional 2.2% |
| Immigrants | Zimbabwe | 99.9 /100 | #29 | Exceptional 2.3% |
| Paraguayans | 99.9 /100 | #30 | Exceptional 2.3% |
| Danes | 99.9 /100 | #31 | Exceptional 2.3% |
Demographics Similar to Jamaicans by Self-Care Disability
In terms of self-care disability, the demographic groups most similar to Jamaicans are Fijian (2.7%, a difference of 0.040%), Delaware (2.7%, a difference of 0.080%), Apache (2.7%, a difference of 0.16%), Immigrants from Iraq (2.7%, a difference of 0.17%), and Hispanic or Latino (2.7%, a difference of 0.33%).
| Demographics | Rating | Rank | Self-Care Disability |
| Ottawa | 0.1 /100 | #278 | Tragic 2.7% |
| Iroquois | 0.1 /100 | #279 | Tragic 2.7% |
| Hispanics or Latinos | 0.1 /100 | #280 | Tragic 2.7% |
| Immigrants | Iraq | 0.0 /100 | #281 | Tragic 2.7% |
| Apache | 0.0 /100 | #282 | Tragic 2.7% |
| Delaware | 0.0 /100 | #283 | Tragic 2.7% |
| Fijians | 0.0 /100 | #284 | Tragic 2.7% |
| Jamaicans | 0.0 /100 | #285 | Tragic 2.7% |
| French American Indians | 0.0 /100 | #286 | Tragic 2.7% |
| Immigrants | Jamaica | 0.0 /100 | #287 | Tragic 2.7% |
| Immigrants | Barbados | 0.0 /100 | #288 | Tragic 2.7% |
| Africans | 0.0 /100 | #289 | Tragic 2.7% |
| Cubans | 0.0 /100 | #290 | Tragic 2.7% |
| Guyanese | 0.0 /100 | #291 | Tragic 2.7% |
| Central American Indians | 0.0 /100 | #292 | Tragic 2.7% |