Yakama vs Immigrants from Taiwan Self-Care Disability
COMPARE
Yakama
Immigrants from Taiwan
Self-Care Disability
Self-Care Disability Comparison
Yakama
Immigrants from Taiwan
2.7%
SELF-CARE DISABILITY
0.1/ 100
METRIC RATING
274th/ 347
METRIC RANK
2.2%
SELF-CARE DISABILITY
100.0/ 100
METRIC RATING
18th/ 347
METRIC RANK
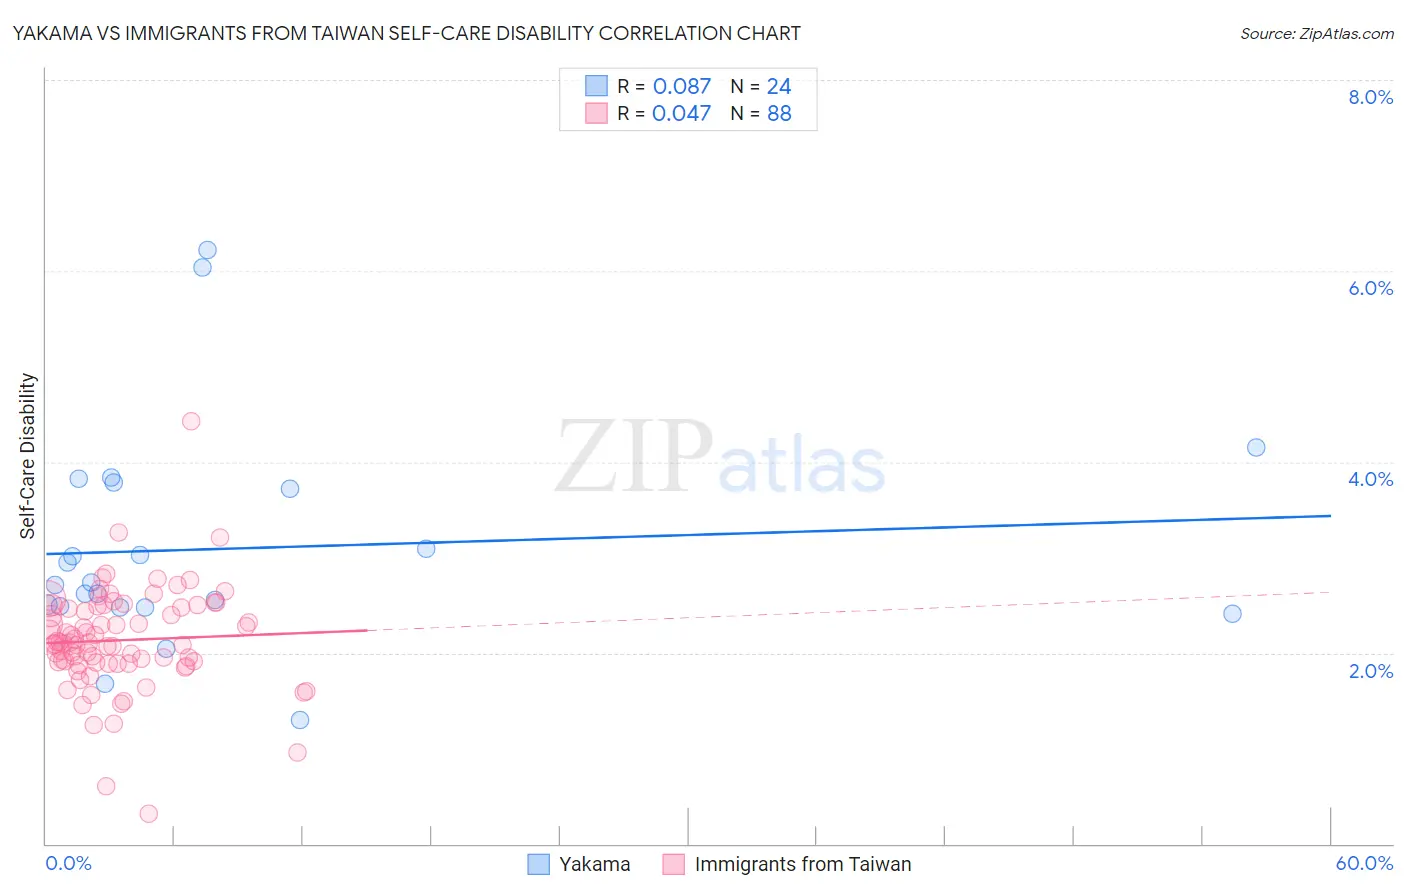
Yakama vs Immigrants from Taiwan Self-Care Disability Correlation Chart
The statistical analysis conducted on geographies consisting of 19,914,398 people shows a slight positive correlation between the proportion of Yakama and percentage of population with self-care disability in the United States with a correlation coefficient (R) of 0.087 and weighted average of 2.7%. Similarly, the statistical analysis conducted on geographies consisting of 297,966,372 people shows no correlation between the proportion of Immigrants from Taiwan and percentage of population with self-care disability in the United States with a correlation coefficient (R) of 0.047 and weighted average of 2.2%, a difference of 21.0%.
Self-Care Disability Correlation Summary
| Measurement | Yakama | Immigrants from Taiwan |
| Minimum | 1.3% | 0.31% |
| Maximum | 6.2% | 4.4% |
| Range | 4.9% | 4.1% |
| Mean | 3.1% | 2.1% |
| Median | 2.7% | 2.1% |
| Interquartile 25% (IQ1) | 2.5% | 1.9% |
| Interquartile 75% (IQ3) | 3.8% | 2.5% |
| Interquartile Range (IQR) | 1.3% | 0.58% |
| Standard Deviation (Sample) | 1.2% | 0.54% |
| Standard Deviation (Population) | 1.1% | 0.54% |
Similar Demographics by Self-Care Disability
Demographics Similar to Yakama by Self-Care Disability
In terms of self-care disability, the demographic groups most similar to Yakama are Immigrants from Trinidad and Tobago (2.7%, a difference of 0.0%), Mexican (2.7%, a difference of 0.060%), Japanese (2.7%, a difference of 0.13%), Immigrants from Ukraine (2.7%, a difference of 0.19%), and Immigrants from Laos (2.7%, a difference of 0.20%).
| Demographics | Rating | Rank | Self-Care Disability |
| Yaqui | 0.1 /100 | #267 | Tragic 2.7% |
| Immigrants | Mexico | 0.1 /100 | #268 | Tragic 2.7% |
| U.S. Virgin Islanders | 0.1 /100 | #269 | Tragic 2.7% |
| Immigrants | Micronesia | 0.1 /100 | #270 | Tragic 2.7% |
| Trinidadians and Tobagonians | 0.1 /100 | #271 | Tragic 2.7% |
| Immigrants | Laos | 0.1 /100 | #272 | Tragic 2.7% |
| Mexicans | 0.1 /100 | #273 | Tragic 2.7% |
| Yakama | 0.1 /100 | #274 | Tragic 2.7% |
| Immigrants | Trinidad and Tobago | 0.1 /100 | #275 | Tragic 2.7% |
| Japanese | 0.1 /100 | #276 | Tragic 2.7% |
| Immigrants | Ukraine | 0.1 /100 | #277 | Tragic 2.7% |
| Ottawa | 0.1 /100 | #278 | Tragic 2.7% |
| Iroquois | 0.1 /100 | #279 | Tragic 2.7% |
| Hispanics or Latinos | 0.1 /100 | #280 | Tragic 2.7% |
| Immigrants | Iraq | 0.0 /100 | #281 | Tragic 2.7% |
Demographics Similar to Immigrants from Taiwan by Self-Care Disability
In terms of self-care disability, the demographic groups most similar to Immigrants from Taiwan are Immigrants from Saudi Arabia (2.2%, a difference of 0.25%), Immigrants from Eritrea (2.2%, a difference of 0.33%), Tongan (2.2%, a difference of 0.41%), Immigrants from Kuwait (2.2%, a difference of 0.42%), and Bulgarian (2.2%, a difference of 0.66%).
| Demographics | Rating | Rank | Self-Care Disability |
| Immigrants | South Central Asia | 100.0 /100 | #11 | Exceptional 2.2% |
| Immigrants | Ethiopia | 100.0 /100 | #12 | Exceptional 2.2% |
| Ethiopians | 100.0 /100 | #13 | Exceptional 2.2% |
| Luxembourgers | 100.0 /100 | #14 | Exceptional 2.2% |
| Okinawans | 100.0 /100 | #15 | Exceptional 2.2% |
| Immigrants | Kuwait | 100.0 /100 | #16 | Exceptional 2.2% |
| Immigrants | Saudi Arabia | 100.0 /100 | #17 | Exceptional 2.2% |
| Immigrants | Taiwan | 100.0 /100 | #18 | Exceptional 2.2% |
| Immigrants | Eritrea | 100.0 /100 | #19 | Exceptional 2.2% |
| Tongans | 100.0 /100 | #20 | Exceptional 2.2% |
| Bulgarians | 100.0 /100 | #21 | Exceptional 2.2% |
| Immigrants | Venezuela | 100.0 /100 | #22 | Exceptional 2.2% |
| Cambodians | 100.0 /100 | #23 | Exceptional 2.2% |
| Cypriots | 100.0 /100 | #24 | Exceptional 2.2% |
| Turks | 100.0 /100 | #25 | Exceptional 2.2% |