Cuban vs Portuguese Disability
COMPARE
Cuban
Portuguese
Disability
Disability Comparison
Cubans
Portuguese
11.7%
DISABILITY
56.7/ 100
METRIC RATING
165th/ 347
METRIC RANK
12.6%
DISABILITY
0.1/ 100
METRIC RATING
270th/ 347
METRIC RANK
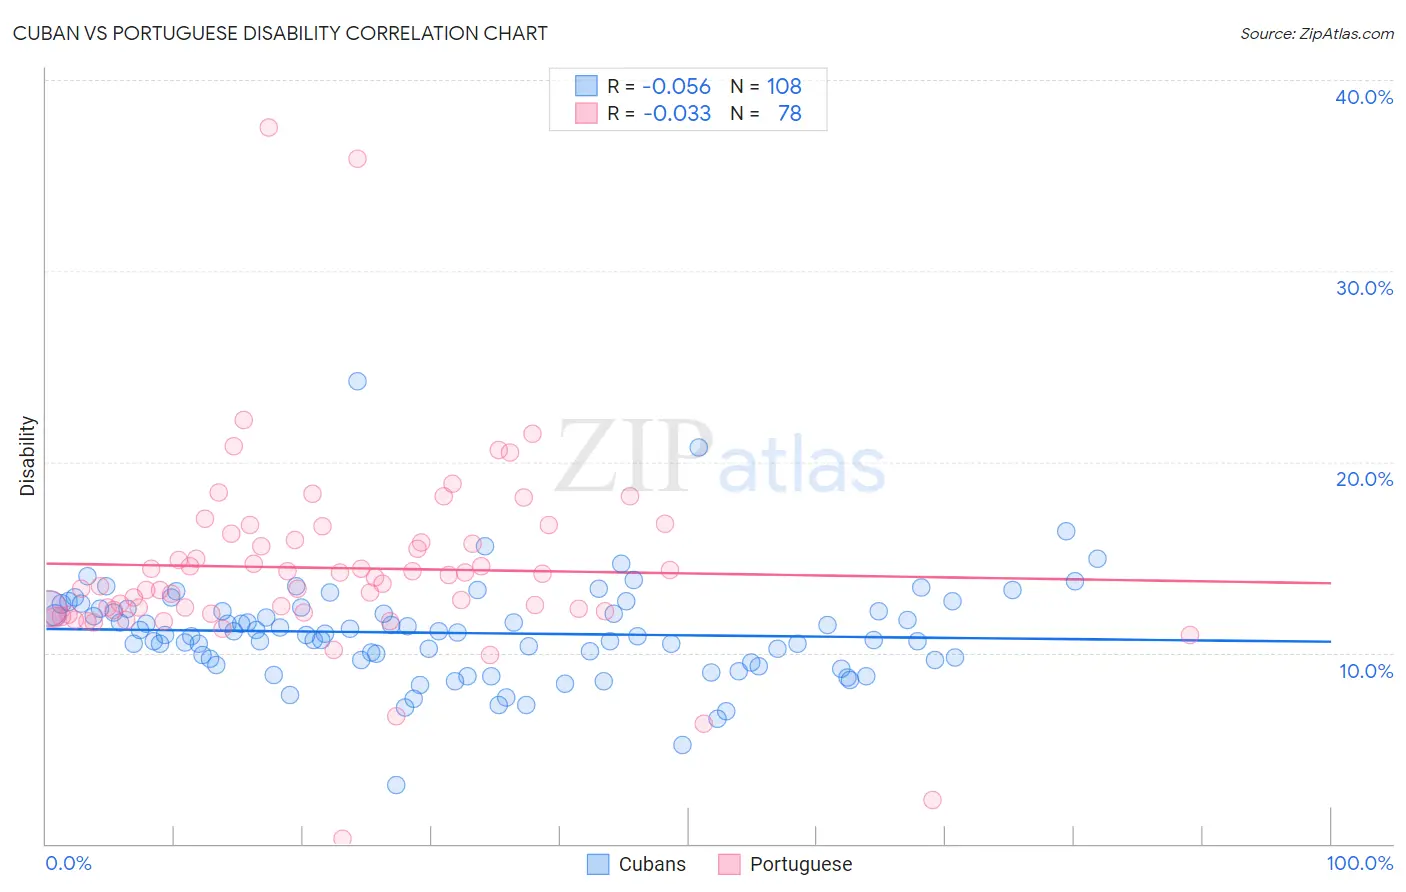
Cuban vs Portuguese Disability Correlation Chart
The statistical analysis conducted on geographies consisting of 449,280,582 people shows a slight negative correlation between the proportion of Cubans and percentage of population with a disability in the United States with a correlation coefficient (R) of -0.056 and weighted average of 11.7%. Similarly, the statistical analysis conducted on geographies consisting of 450,275,372 people shows no correlation between the proportion of Portuguese and percentage of population with a disability in the United States with a correlation coefficient (R) of -0.033 and weighted average of 12.6%, a difference of 8.2%.
Disability Correlation Summary
| Measurement | Cuban | Portuguese |
| Minimum | 3.1% | 0.28% |
| Maximum | 24.2% | 37.5% |
| Range | 21.1% | 37.2% |
| Mean | 11.0% | 14.4% |
| Median | 11.0% | 13.8% |
| Interquartile 25% (IQ1) | 9.6% | 12.2% |
| Interquartile 75% (IQ3) | 12.3% | 15.9% |
| Interquartile Range (IQR) | 2.7% | 3.7% |
| Standard Deviation (Sample) | 2.7% | 5.1% |
| Standard Deviation (Population) | 2.6% | 5.1% |
Similar Demographics by Disability
Demographics Similar to Cubans by Disability
In terms of disability, the demographic groups most similar to Cubans are Syrian (11.7%, a difference of 0.080%), Pakistani (11.7%, a difference of 0.090%), Immigrants from Trinidad and Tobago (11.7%, a difference of 0.10%), Estonian (11.7%, a difference of 0.10%), and Immigrants from Haiti (11.7%, a difference of 0.12%).
| Demographics | Rating | Rank | Disability |
| Armenians | 65.9 /100 | #158 | Good 11.6% |
| Guatemalans | 65.1 /100 | #159 | Good 11.6% |
| Immigrants | Barbados | 64.2 /100 | #160 | Good 11.6% |
| Immigrants | Cuba | 62.8 /100 | #161 | Good 11.6% |
| Immigrants | Haiti | 59.2 /100 | #162 | Average 11.7% |
| Immigrants | Trinidad and Tobago | 58.9 /100 | #163 | Average 11.7% |
| Syrians | 58.5 /100 | #164 | Average 11.7% |
| Cubans | 56.7 /100 | #165 | Average 11.7% |
| Pakistanis | 54.7 /100 | #166 | Average 11.7% |
| Estonians | 54.4 /100 | #167 | Average 11.7% |
| Immigrants | Latin America | 54.1 /100 | #168 | Average 11.7% |
| Immigrants | Austria | 53.4 /100 | #169 | Average 11.7% |
| Immigrants | Albania | 52.8 /100 | #170 | Average 11.7% |
| Immigrants | Southern Europe | 52.8 /100 | #171 | Average 11.7% |
| Trinidadians and Tobagonians | 52.7 /100 | #172 | Average 11.7% |
Demographics Similar to Portuguese by Disability
In terms of disability, the demographic groups most similar to Portuguese are Immigrants from Yemen (12.6%, a difference of 0.050%), Immigrants from Dominican Republic (12.6%, a difference of 0.39%), Bangladeshi (12.6%, a difference of 0.48%), Dominican (12.7%, a difference of 0.54%), and Finnish (12.7%, a difference of 0.70%).
| Demographics | Rating | Rank | Disability |
| Hawaiians | 0.2 /100 | #263 | Tragic 12.5% |
| Immigrants | Germany | 0.2 /100 | #264 | Tragic 12.5% |
| U.S. Virgin Islanders | 0.2 /100 | #265 | Tragic 12.5% |
| Czechoslovakians | 0.2 /100 | #266 | Tragic 12.5% |
| Spaniards | 0.2 /100 | #267 | Tragic 12.5% |
| Bangladeshis | 0.1 /100 | #268 | Tragic 12.6% |
| Immigrants | Dominican Republic | 0.1 /100 | #269 | Tragic 12.6% |
| Portuguese | 0.1 /100 | #270 | Tragic 12.6% |
| Immigrants | Yemen | 0.1 /100 | #271 | Tragic 12.6% |
| Dominicans | 0.0 /100 | #272 | Tragic 12.7% |
| Finns | 0.0 /100 | #273 | Tragic 12.7% |
| Nepalese | 0.0 /100 | #274 | Tragic 12.8% |
| Sioux | 0.0 /100 | #275 | Tragic 12.8% |
| Hmong | 0.0 /100 | #276 | Tragic 12.8% |
| Dutch | 0.0 /100 | #277 | Tragic 12.8% |