Cuban vs British West Indian Disability
COMPARE
Cuban
British West Indian
Disability
Disability Comparison
Cubans
British West Indians
11.7%
DISABILITY
56.7/ 100
METRIC RATING
165th/ 347
METRIC RANK
12.0%
DISABILITY
11.5/ 100
METRIC RATING
203rd/ 347
METRIC RANK
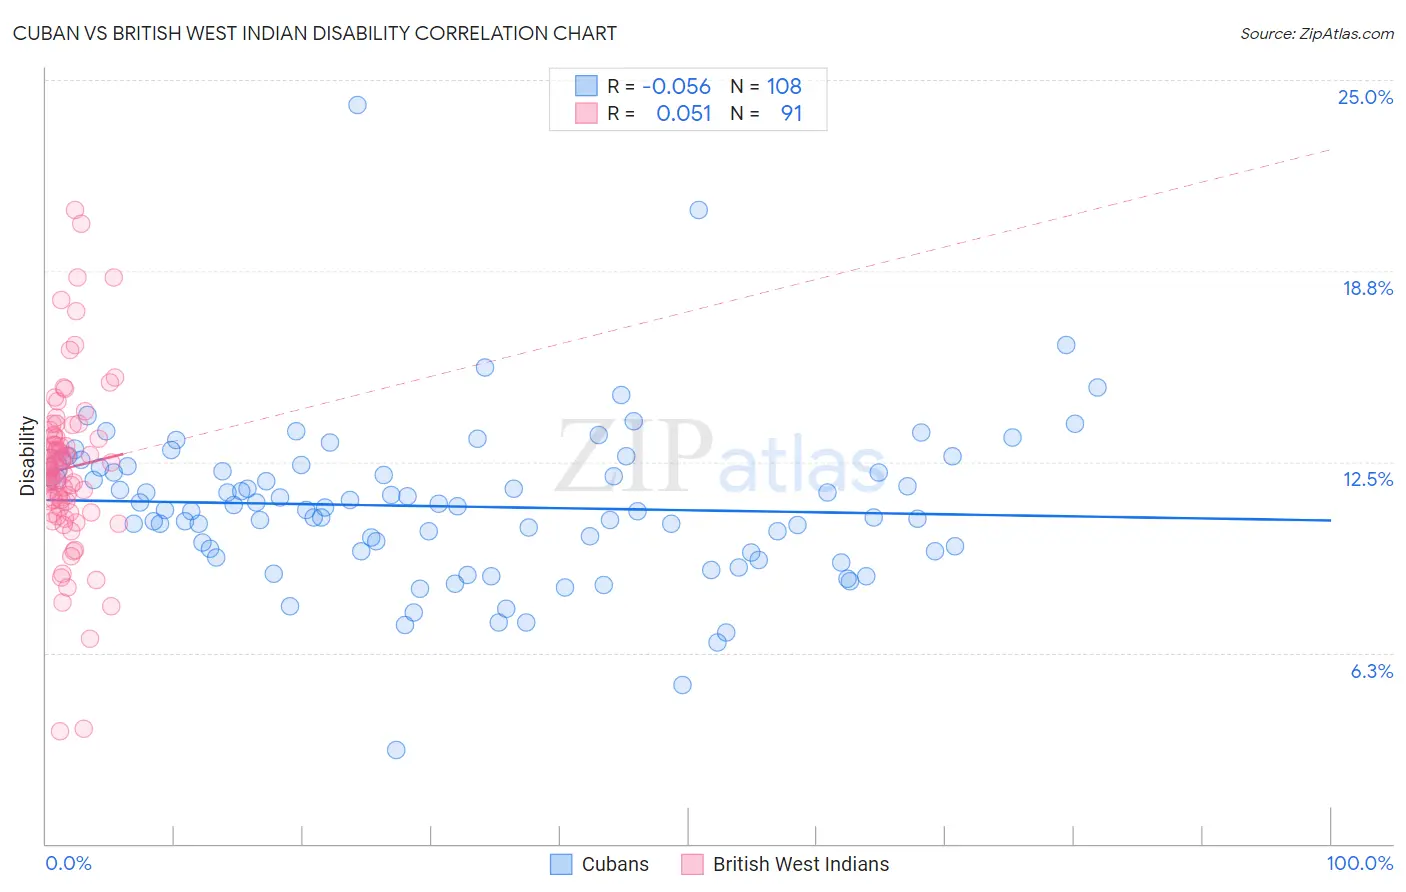
Cuban vs British West Indian Disability Correlation Chart
The statistical analysis conducted on geographies consisting of 449,280,582 people shows a slight negative correlation between the proportion of Cubans and percentage of population with a disability in the United States with a correlation coefficient (R) of -0.056 and weighted average of 11.7%. Similarly, the statistical analysis conducted on geographies consisting of 152,680,197 people shows a slight positive correlation between the proportion of British West Indians and percentage of population with a disability in the United States with a correlation coefficient (R) of 0.051 and weighted average of 12.0%, a difference of 2.6%.
Disability Correlation Summary
| Measurement | Cuban | British West Indian |
| Minimum | 3.1% | 3.7% |
| Maximum | 24.2% | 20.8% |
| Range | 21.1% | 17.1% |
| Mean | 11.0% | 12.3% |
| Median | 11.0% | 12.2% |
| Interquartile 25% (IQ1) | 9.6% | 11.0% |
| Interquartile 75% (IQ3) | 12.3% | 13.3% |
| Interquartile Range (IQR) | 2.7% | 2.3% |
| Standard Deviation (Sample) | 2.7% | 2.8% |
| Standard Deviation (Population) | 2.6% | 2.8% |
Similar Demographics by Disability
Demographics Similar to Cubans by Disability
In terms of disability, the demographic groups most similar to Cubans are Syrian (11.7%, a difference of 0.080%), Pakistani (11.7%, a difference of 0.090%), Immigrants from Trinidad and Tobago (11.7%, a difference of 0.10%), Estonian (11.7%, a difference of 0.10%), and Immigrants from Haiti (11.7%, a difference of 0.12%).
| Demographics | Rating | Rank | Disability |
| Armenians | 65.9 /100 | #158 | Good 11.6% |
| Guatemalans | 65.1 /100 | #159 | Good 11.6% |
| Immigrants | Barbados | 64.2 /100 | #160 | Good 11.6% |
| Immigrants | Cuba | 62.8 /100 | #161 | Good 11.6% |
| Immigrants | Haiti | 59.2 /100 | #162 | Average 11.7% |
| Immigrants | Trinidad and Tobago | 58.9 /100 | #163 | Average 11.7% |
| Syrians | 58.5 /100 | #164 | Average 11.7% |
| Cubans | 56.7 /100 | #165 | Average 11.7% |
| Pakistanis | 54.7 /100 | #166 | Average 11.7% |
| Estonians | 54.4 /100 | #167 | Average 11.7% |
| Immigrants | Latin America | 54.1 /100 | #168 | Average 11.7% |
| Immigrants | Austria | 53.4 /100 | #169 | Average 11.7% |
| Immigrants | Albania | 52.8 /100 | #170 | Average 11.7% |
| Immigrants | Southern Europe | 52.8 /100 | #171 | Average 11.7% |
| Trinidadians and Tobagonians | 52.7 /100 | #172 | Average 11.7% |
Demographics Similar to British West Indians by Disability
In terms of disability, the demographic groups most similar to British West Indians are Mexican American Indian (12.0%, a difference of 0.0%), Immigrants from England (12.0%, a difference of 0.050%), Assyrian/Chaldean/Syriac (11.9%, a difference of 0.12%), Belizean (11.9%, a difference of 0.14%), and Immigrants from Western Europe (12.0%, a difference of 0.16%).
| Demographics | Rating | Rank | Disability |
| Serbians | 15.4 /100 | #196 | Poor 11.9% |
| Immigrants | Belize | 15.2 /100 | #197 | Poor 11.9% |
| Ukrainians | 14.7 /100 | #198 | Poor 11.9% |
| Immigrants | Panama | 14.6 /100 | #199 | Poor 11.9% |
| Belizeans | 12.8 /100 | #200 | Poor 11.9% |
| Assyrians/Chaldeans/Syriacs | 12.6 /100 | #201 | Poor 11.9% |
| Immigrants | England | 12.0 /100 | #202 | Poor 12.0% |
| British West Indians | 11.5 /100 | #203 | Poor 12.0% |
| Mexican American Indians | 11.4 /100 | #204 | Poor 12.0% |
| Immigrants | Western Europe | 10.1 /100 | #205 | Poor 12.0% |
| Immigrants | Senegal | 9.4 /100 | #206 | Tragic 12.0% |
| Immigrants | Thailand | 9.3 /100 | #207 | Tragic 12.0% |
| Immigrants | Caribbean | 9.1 /100 | #208 | Tragic 12.0% |
| Danes | 8.7 /100 | #209 | Tragic 12.0% |
| Czechs | 7.9 /100 | #210 | Tragic 12.0% |