Cuban vs Yakama Currently Married
COMPARE
Cuban
Yakama
Currently Married
Currently Married Comparison
Cubans
Yakama
44.6%
CURRENTLY MARRIED
0.9/ 100
METRIC RATING
236th/ 347
METRIC RANK
44.0%
CURRENTLY MARRIED
0.2/ 100
METRIC RATING
255th/ 347
METRIC RANK
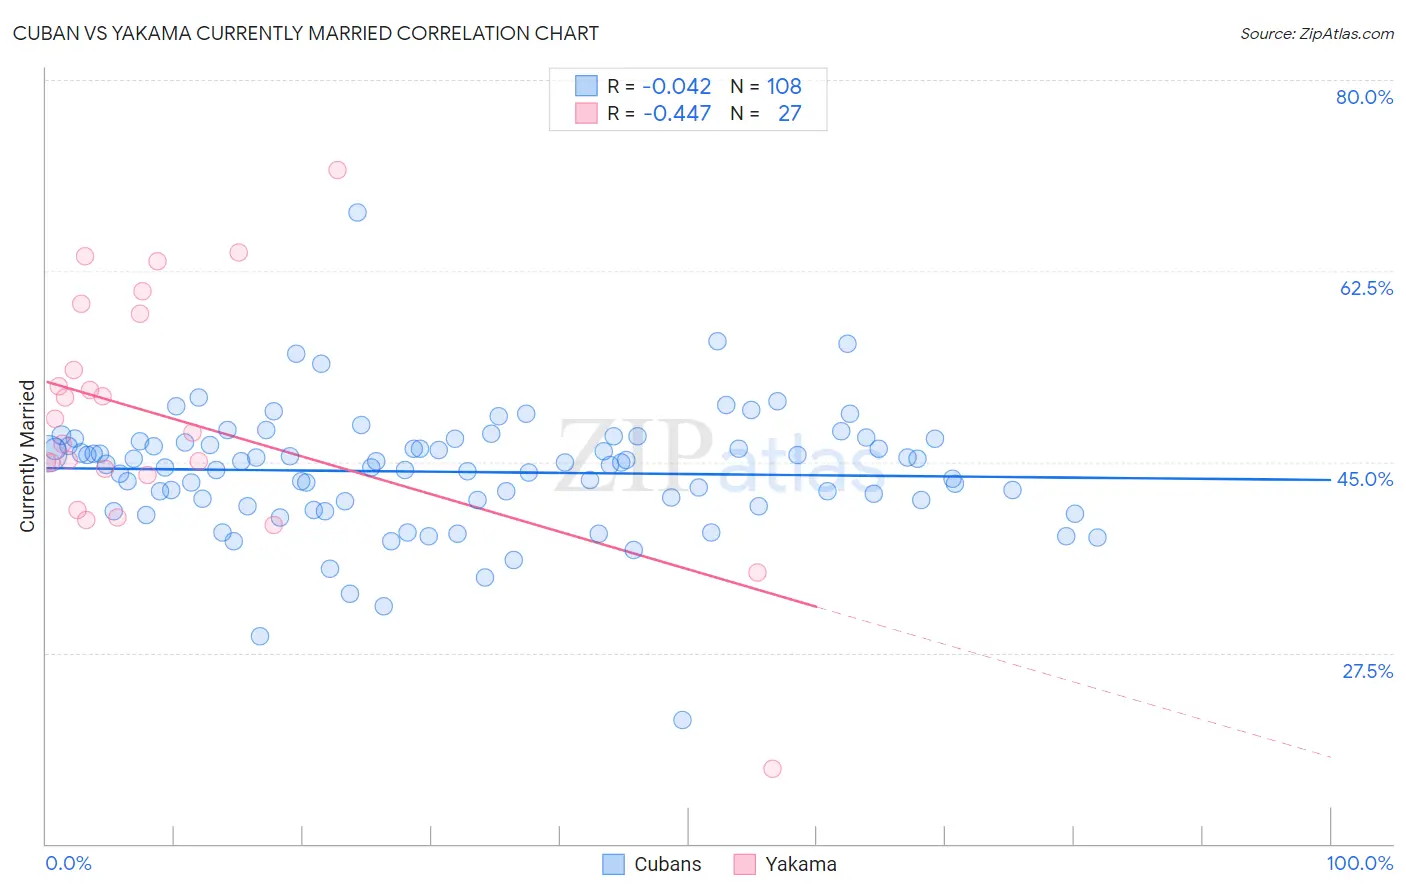
Cuban vs Yakama Currently Married Correlation Chart
The statistical analysis conducted on geographies consisting of 449,312,568 people shows no correlation between the proportion of Cubans and percentage of population currently married in the United States with a correlation coefficient (R) of -0.042 and weighted average of 44.6%. Similarly, the statistical analysis conducted on geographies consisting of 19,923,144 people shows a moderate negative correlation between the proportion of Yakama and percentage of population currently married in the United States with a correlation coefficient (R) of -0.447 and weighted average of 44.0%, a difference of 1.5%.
Currently Married Correlation Summary
| Measurement | Cuban | Yakama |
| Minimum | 21.3% | 16.9% |
| Maximum | 67.9% | 71.8% |
| Range | 46.6% | 54.9% |
| Mean | 44.1% | 49.0% |
| Median | 44.8% | 47.7% |
| Interquartile 25% (IQ1) | 41.4% | 43.8% |
| Interquartile 75% (IQ3) | 46.9% | 58.6% |
| Interquartile Range (IQR) | 5.4% | 14.8% |
| Standard Deviation (Sample) | 5.7% | 11.2% |
| Standard Deviation (Population) | 5.6% | 11.0% |
Demographics Similar to Cubans and Yakama by Currently Married
In terms of currently married, the demographic groups most similar to Cubans are Seminole (44.6%, a difference of 0.0%), Alaskan Athabascan (44.6%, a difference of 0.010%), Moroccan (44.6%, a difference of 0.080%), Immigrants from Mexico (44.5%, a difference of 0.22%), and Mexican American Indian (44.5%, a difference of 0.23%). Similarly, the demographic groups most similar to Yakama are Vietnamese (44.0%, a difference of 0.070%), Immigrants from Central America (44.1%, a difference of 0.32%), Hispanic or Latino (44.1%, a difference of 0.35%), Blackfeet (44.2%, a difference of 0.37%), and Immigrants from Eastern Africa (44.2%, a difference of 0.43%).
| Demographics | Rating | Rank | Currently Married |
| Alaskan Athabascans | 0.9 /100 | #235 | Tragic 44.6% |
| Cubans | 0.9 /100 | #236 | Tragic 44.6% |
| Seminole | 0.9 /100 | #237 | Tragic 44.6% |
| Moroccans | 0.9 /100 | #238 | Tragic 44.6% |
| Immigrants | Mexico | 0.7 /100 | #239 | Tragic 44.5% |
| Mexican American Indians | 0.7 /100 | #240 | Tragic 44.5% |
| Ethiopians | 0.7 /100 | #241 | Tragic 44.5% |
| Immigrants | Cambodia | 0.7 /100 | #242 | Tragic 44.5% |
| Immigrants | Ethiopia | 0.7 /100 | #243 | Tragic 44.5% |
| Japanese | 0.6 /100 | #244 | Tragic 44.5% |
| Immigrants | Armenia | 0.4 /100 | #245 | Tragic 44.3% |
| Immigrants | Burma/Myanmar | 0.4 /100 | #246 | Tragic 44.3% |
| Ugandans | 0.4 /100 | #247 | Tragic 44.2% |
| Nicaraguans | 0.3 /100 | #248 | Tragic 44.2% |
| Immigrants | Cameroon | 0.3 /100 | #249 | Tragic 44.2% |
| Immigrants | Eastern Africa | 0.3 /100 | #250 | Tragic 44.2% |
| Blackfeet | 0.3 /100 | #251 | Tragic 44.2% |
| Hispanics or Latinos | 0.3 /100 | #252 | Tragic 44.1% |
| Immigrants | Central America | 0.3 /100 | #253 | Tragic 44.1% |
| Vietnamese | 0.2 /100 | #254 | Tragic 44.0% |
| Yakama | 0.2 /100 | #255 | Tragic 44.0% |