Immigrants from South Eastern Asia vs South African Female Disability
COMPARE
Immigrants from South Eastern Asia
South African
Female Disability
Female Disability Comparison
Immigrants from South Eastern Asia
South Africans
11.7%
FEMALE DISABILITY
98.4/ 100
METRIC RATING
102nd/ 347
METRIC RANK
11.8%
FEMALE DISABILITY
97.7/ 100
METRIC RATING
114th/ 347
METRIC RANK
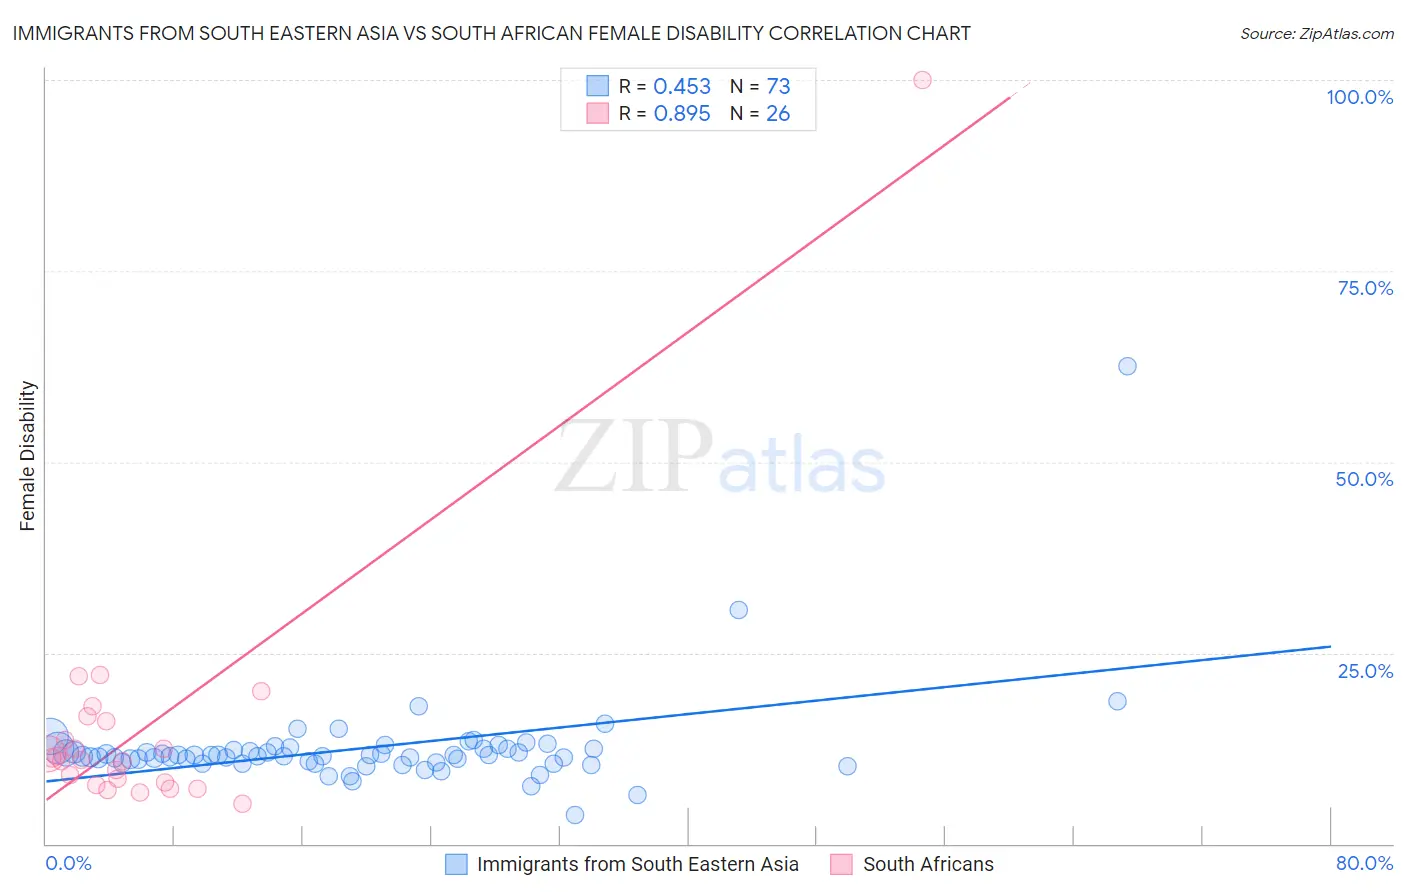
Immigrants from South Eastern Asia vs South African Female Disability Correlation Chart
The statistical analysis conducted on geographies consisting of 512,540,342 people shows a moderate positive correlation between the proportion of Immigrants from South Eastern Asia and percentage of females with a disability in the United States with a correlation coefficient (R) of 0.453 and weighted average of 11.7%. Similarly, the statistical analysis conducted on geographies consisting of 182,588,649 people shows a very strong positive correlation between the proportion of South Africans and percentage of females with a disability in the United States with a correlation coefficient (R) of 0.895 and weighted average of 11.8%, a difference of 0.37%.
Female Disability Correlation Summary
| Measurement | Immigrants from South Eastern Asia | South African |
| Minimum | 3.8% | 5.3% |
| Maximum | 62.5% | 100.0% |
| Range | 58.7% | 94.7% |
| Mean | 12.5% | 15.3% |
| Median | 11.6% | 11.1% |
| Interquartile 25% (IQ1) | 10.7% | 8.1% |
| Interquartile 75% (IQ3) | 12.4% | 16.1% |
| Interquartile Range (IQR) | 1.8% | 8.0% |
| Standard Deviation (Sample) | 6.7% | 17.9% |
| Standard Deviation (Population) | 6.6% | 17.6% |
Demographics Similar to Immigrants from South Eastern Asia and South Africans by Female Disability
In terms of female disability, the demographic groups most similar to Immigrants from South Eastern Asia are Immigrants from Costa Rica (11.7%, a difference of 0.010%), Immigrants from Uruguay (11.7%, a difference of 0.030%), Immigrants from Eastern Africa (11.7%, a difference of 0.070%), Immigrants from Philippines (11.7%, a difference of 0.080%), and Immigrants from Western Asia (11.7%, a difference of 0.080%). Similarly, the demographic groups most similar to South Africans are Brazilian (11.8%, a difference of 0.0%), Immigrants from Belarus (11.8%, a difference of 0.030%), Immigrants from Bangladesh (11.8%, a difference of 0.040%), Immigrants from Morocco (11.8%, a difference of 0.050%), and Costa Rican (11.7%, a difference of 0.16%).
| Demographics | Rating | Rank | Female Disability |
| Uruguayans | 98.8 /100 | #98 | Exceptional 11.7% |
| Immigrants | Philippines | 98.6 /100 | #99 | Exceptional 11.7% |
| Immigrants | Uruguay | 98.5 /100 | #100 | Exceptional 11.7% |
| Immigrants | Costa Rica | 98.4 /100 | #101 | Exceptional 11.7% |
| Immigrants | South Eastern Asia | 98.4 /100 | #102 | Exceptional 11.7% |
| Immigrants | Eastern Africa | 98.3 /100 | #103 | Exceptional 11.7% |
| Immigrants | Western Asia | 98.3 /100 | #104 | Exceptional 11.7% |
| Australians | 98.3 /100 | #105 | Exceptional 11.7% |
| Immigrants | Greece | 98.2 /100 | #106 | Exceptional 11.7% |
| Latvians | 98.2 /100 | #107 | Exceptional 11.7% |
| New Zealanders | 98.1 /100 | #108 | Exceptional 11.7% |
| Immigrants | Immigrants | 98.1 /100 | #109 | Exceptional 11.7% |
| Soviet Union | 98.1 /100 | #110 | Exceptional 11.7% |
| Costa Ricans | 98.1 /100 | #111 | Exceptional 11.7% |
| Immigrants | Bangladesh | 97.8 /100 | #112 | Exceptional 11.8% |
| Immigrants | Belarus | 97.8 /100 | #113 | Exceptional 11.8% |
| South Africans | 97.7 /100 | #114 | Exceptional 11.8% |
| Brazilians | 97.7 /100 | #115 | Exceptional 11.8% |
| Immigrants | Morocco | 97.6 /100 | #116 | Exceptional 11.8% |
| Immigrants | Eastern Europe | 97.2 /100 | #117 | Exceptional 11.8% |
| Immigrants | Nigeria | 97.2 /100 | #118 | Exceptional 11.8% |