Cuban vs Central American Indian Female Disability
COMPARE
Cuban
Central American Indian
Female Disability
Female Disability Comparison
Cubans
Central American Indians
12.3%
FEMALE DISABILITY
36.5/ 100
METRIC RATING
183rd/ 347
METRIC RANK
13.6%
FEMALE DISABILITY
0.0/ 100
METRIC RATING
307th/ 347
METRIC RANK
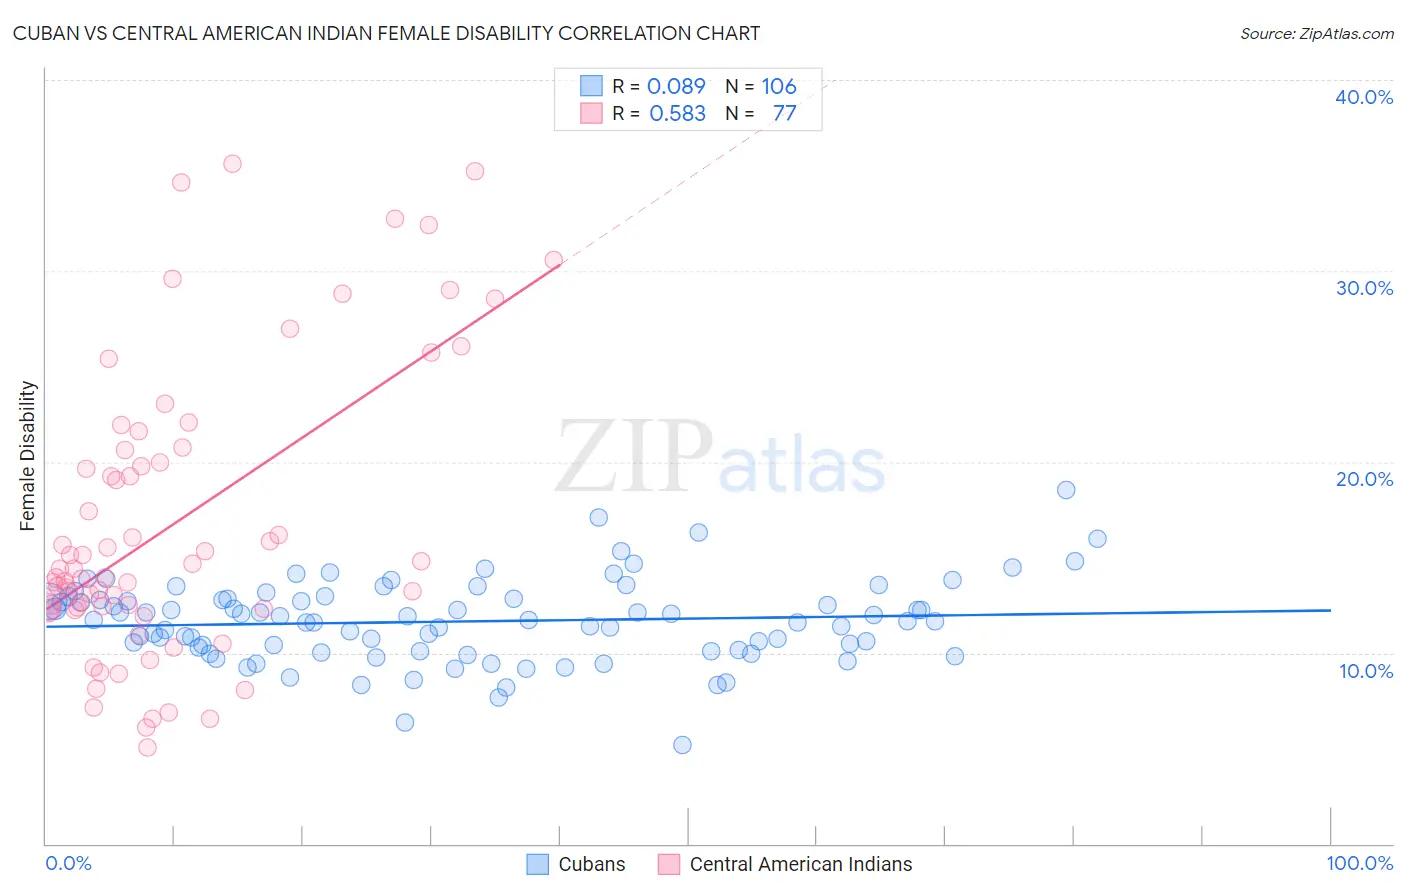
Cuban vs Central American Indian Female Disability Correlation Chart
The statistical analysis conducted on geographies consisting of 449,245,212 people shows a slight positive correlation between the proportion of Cubans and percentage of females with a disability in the United States with a correlation coefficient (R) of 0.089 and weighted average of 12.3%. Similarly, the statistical analysis conducted on geographies consisting of 326,112,462 people shows a substantial positive correlation between the proportion of Central American Indians and percentage of females with a disability in the United States with a correlation coefficient (R) of 0.583 and weighted average of 13.6%, a difference of 11.1%.
Female Disability Correlation Summary
| Measurement | Cuban | Central American Indian |
| Minimum | 5.2% | 5.1% |
| Maximum | 18.5% | 35.6% |
| Range | 13.3% | 30.5% |
| Mean | 11.6% | 16.8% |
| Median | 11.7% | 14.4% |
| Interquartile 25% (IQ1) | 10.1% | 12.3% |
| Interquartile 75% (IQ3) | 12.8% | 20.7% |
| Interquartile Range (IQR) | 2.7% | 8.3% |
| Standard Deviation (Sample) | 2.1% | 7.6% |
| Standard Deviation (Population) | 2.1% | 7.5% |
Similar Demographics by Female Disability
Demographics Similar to Cubans by Female Disability
In terms of female disability, the demographic groups most similar to Cubans are Norwegian (12.3%, a difference of 0.020%), Iraqi (12.3%, a difference of 0.020%), Immigrants from Canada (12.3%, a difference of 0.030%), Albanian (12.3%, a difference of 0.060%), and Immigrants from Fiji (12.3%, a difference of 0.070%).
| Demographics | Rating | Rank | Female Disability |
| Immigrants | Guyana | 43.1 /100 | #176 | Average 12.2% |
| Immigrants | Ghana | 42.5 /100 | #177 | Average 12.2% |
| Immigrants | Western Europe | 40.9 /100 | #178 | Average 12.2% |
| Immigrants | Fiji | 38.2 /100 | #179 | Fair 12.3% |
| Albanians | 37.9 /100 | #180 | Fair 12.3% |
| Immigrants | Canada | 37.2 /100 | #181 | Fair 12.3% |
| Norwegians | 36.9 /100 | #182 | Fair 12.3% |
| Cubans | 36.5 /100 | #183 | Fair 12.3% |
| Iraqis | 36.0 /100 | #184 | Fair 12.3% |
| Immigrants | Uzbekistan | 33.9 /100 | #185 | Fair 12.3% |
| Austrians | 33.3 /100 | #186 | Fair 12.3% |
| Serbians | 33.1 /100 | #187 | Fair 12.3% |
| Immigrants | North America | 32.8 /100 | #188 | Fair 12.3% |
| Immigrants | Albania | 31.6 /100 | #189 | Fair 12.3% |
| Immigrants | Honduras | 31.3 /100 | #190 | Fair 12.3% |
Demographics Similar to Central American Indians by Female Disability
In terms of female disability, the demographic groups most similar to Central American Indians are French Canadian (13.6%, a difference of 0.29%), Cree (13.7%, a difference of 0.46%), French American Indian (13.7%, a difference of 0.52%), Apache (13.7%, a difference of 0.63%), and Dominican (13.5%, a difference of 0.92%).
| Demographics | Rating | Rank | Female Disability |
| Pennsylvania Germans | 0.0 /100 | #300 | Tragic 13.4% |
| Africans | 0.0 /100 | #301 | Tragic 13.4% |
| Scotch-Irish | 0.0 /100 | #302 | Tragic 13.4% |
| Immigrants | Portugal | 0.0 /100 | #303 | Tragic 13.5% |
| Immigrants | Micronesia | 0.0 /100 | #304 | Tragic 13.5% |
| Dominicans | 0.0 /100 | #305 | Tragic 13.5% |
| French Canadians | 0.0 /100 | #306 | Tragic 13.6% |
| Central American Indians | 0.0 /100 | #307 | Tragic 13.6% |
| Cree | 0.0 /100 | #308 | Tragic 13.7% |
| French American Indians | 0.0 /100 | #309 | Tragic 13.7% |
| Apache | 0.0 /100 | #310 | Tragic 13.7% |
| Hopi | 0.0 /100 | #311 | Tragic 13.7% |
| Delaware | 0.0 /100 | #312 | Tragic 13.8% |
| Blackfeet | 0.0 /100 | #313 | Tragic 13.8% |
| Puget Sound Salish | 0.0 /100 | #314 | Tragic 13.8% |