Cuban vs Aleut Female Disability
COMPARE
Cuban
Aleut
Female Disability
Female Disability Comparison
Cubans
Aleuts
12.3%
FEMALE DISABILITY
36.5/ 100
METRIC RATING
183rd/ 347
METRIC RANK
12.7%
FEMALE DISABILITY
1.1/ 100
METRIC RATING
258th/ 347
METRIC RANK
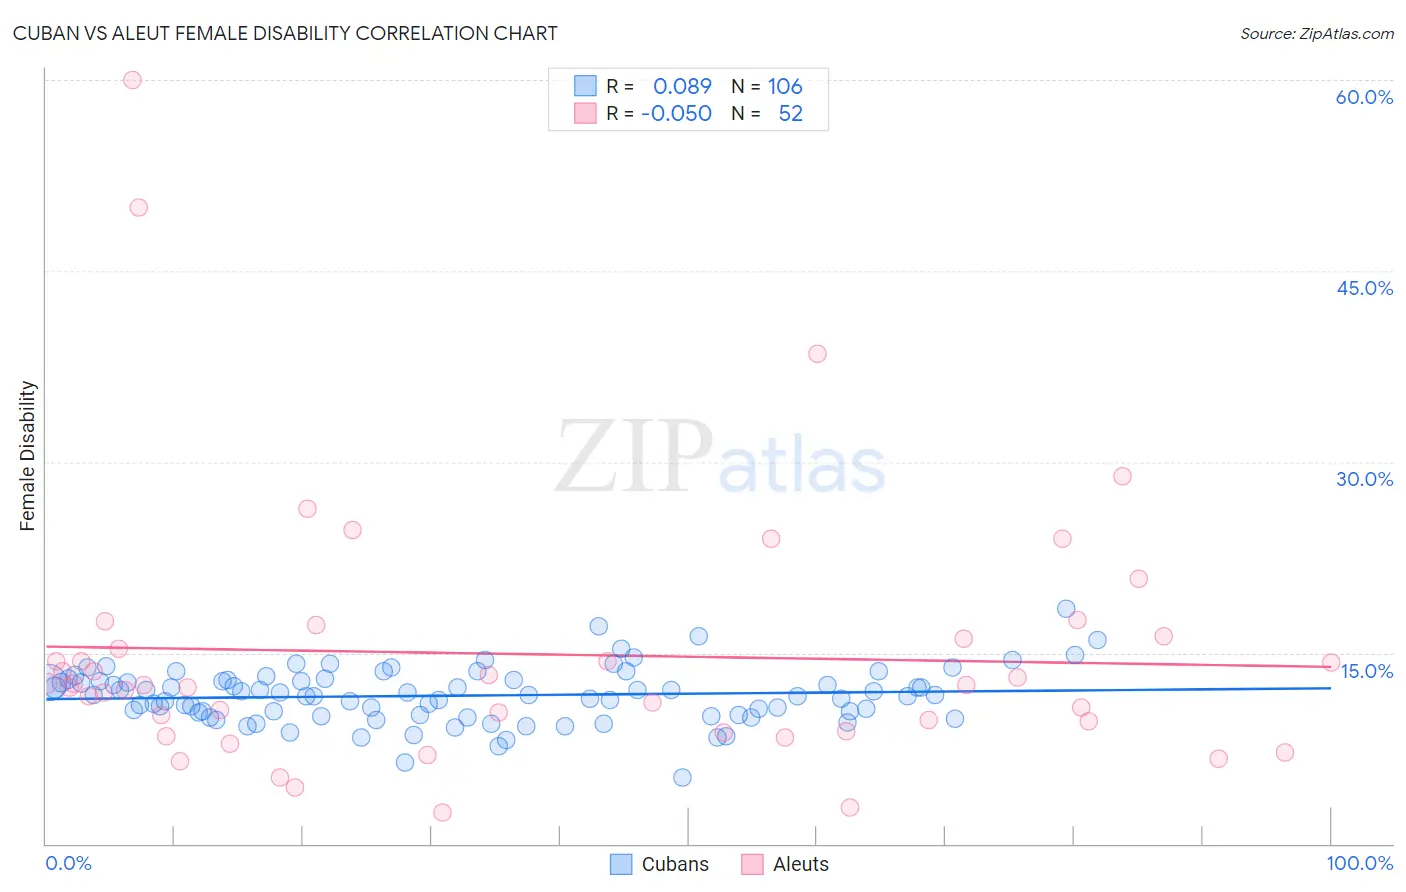
Cuban vs Aleut Female Disability Correlation Chart
The statistical analysis conducted on geographies consisting of 449,245,212 people shows a slight positive correlation between the proportion of Cubans and percentage of females with a disability in the United States with a correlation coefficient (R) of 0.089 and weighted average of 12.3%. Similarly, the statistical analysis conducted on geographies consisting of 61,781,040 people shows no correlation between the proportion of Aleuts and percentage of females with a disability in the United States with a correlation coefficient (R) of -0.050 and weighted average of 12.7%, a difference of 3.7%.
Female Disability Correlation Summary
| Measurement | Cuban | Aleut |
| Minimum | 5.2% | 2.5% |
| Maximum | 18.5% | 60.0% |
| Range | 13.3% | 57.5% |
| Mean | 11.6% | 14.9% |
| Median | 11.7% | 12.5% |
| Interquartile 25% (IQ1) | 10.1% | 9.2% |
| Interquartile 75% (IQ3) | 12.8% | 16.2% |
| Interquartile Range (IQR) | 2.7% | 7.0% |
| Standard Deviation (Sample) | 2.1% | 10.5% |
| Standard Deviation (Population) | 2.1% | 10.4% |
Similar Demographics by Female Disability
Demographics Similar to Cubans by Female Disability
In terms of female disability, the demographic groups most similar to Cubans are Norwegian (12.3%, a difference of 0.020%), Iraqi (12.3%, a difference of 0.020%), Immigrants from Canada (12.3%, a difference of 0.030%), Albanian (12.3%, a difference of 0.060%), and Immigrants from Fiji (12.3%, a difference of 0.070%).
| Demographics | Rating | Rank | Female Disability |
| Immigrants | Guyana | 43.1 /100 | #176 | Average 12.2% |
| Immigrants | Ghana | 42.5 /100 | #177 | Average 12.2% |
| Immigrants | Western Europe | 40.9 /100 | #178 | Average 12.2% |
| Immigrants | Fiji | 38.2 /100 | #179 | Fair 12.3% |
| Albanians | 37.9 /100 | #180 | Fair 12.3% |
| Immigrants | Canada | 37.2 /100 | #181 | Fair 12.3% |
| Norwegians | 36.9 /100 | #182 | Fair 12.3% |
| Cubans | 36.5 /100 | #183 | Fair 12.3% |
| Iraqis | 36.0 /100 | #184 | Fair 12.3% |
| Immigrants | Uzbekistan | 33.9 /100 | #185 | Fair 12.3% |
| Austrians | 33.3 /100 | #186 | Fair 12.3% |
| Serbians | 33.1 /100 | #187 | Fair 12.3% |
| Immigrants | North America | 32.8 /100 | #188 | Fair 12.3% |
| Immigrants | Albania | 31.6 /100 | #189 | Fair 12.3% |
| Immigrants | Honduras | 31.3 /100 | #190 | Fair 12.3% |
Demographics Similar to Aleuts by Female Disability
In terms of female disability, the demographic groups most similar to Aleuts are Liberian (12.7%, a difference of 0.0%), British West Indian (12.7%, a difference of 0.030%), Immigrants from Armenia (12.7%, a difference of 0.080%), Subsaharan African (12.7%, a difference of 0.090%), and Immigrants from Germany (12.7%, a difference of 0.10%).
| Demographics | Rating | Rank | Female Disability |
| Crow | 1.6 /100 | #251 | Tragic 12.7% |
| Immigrants | Caribbean | 1.4 /100 | #252 | Tragic 12.7% |
| Jamaicans | 1.4 /100 | #253 | Tragic 12.7% |
| Hawaiians | 1.4 /100 | #254 | Tragic 12.7% |
| Immigrants | Germany | 1.3 /100 | #255 | Tragic 12.7% |
| British West Indians | 1.2 /100 | #256 | Tragic 12.7% |
| Liberians | 1.1 /100 | #257 | Tragic 12.7% |
| Aleuts | 1.1 /100 | #258 | Tragic 12.7% |
| Immigrants | Armenia | 1.0 /100 | #259 | Tragic 12.7% |
| Sub-Saharan Africans | 1.0 /100 | #260 | Tragic 12.7% |
| Bermudans | 1.0 /100 | #261 | Tragic 12.7% |
| Czechoslovakians | 0.9 /100 | #262 | Tragic 12.7% |
| Spaniards | 0.7 /100 | #263 | Tragic 12.8% |
| Alaska Natives | 0.6 /100 | #264 | Tragic 12.8% |
| West Indians | 0.5 /100 | #265 | Tragic 12.8% |