Cuban vs Czech Disability Age 5 to 17
COMPARE
Cuban
Czech
Disability Age 5 to 17
Disability Age 5 to 17 Comparison
Cubans
Czechs
5.3%
DISABILITY AGE 5 TO 17
97.8/ 100
METRIC RATING
115th/ 347
METRIC RANK
5.8%
DISABILITY AGE 5 TO 17
7.4/ 100
METRIC RATING
217th/ 347
METRIC RANK
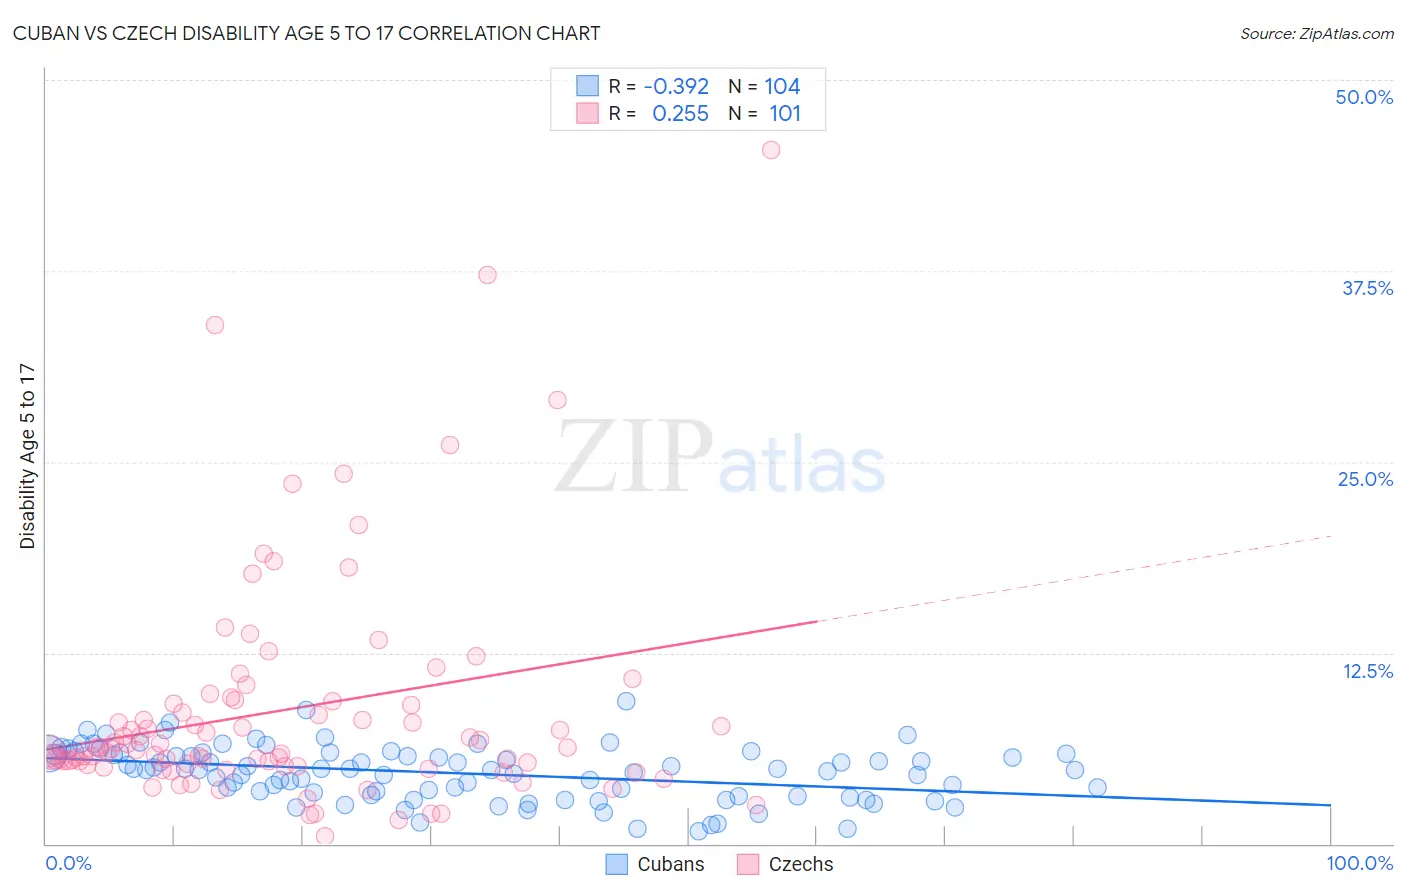
Cuban vs Czech Disability Age 5 to 17 Correlation Chart
The statistical analysis conducted on geographies consisting of 444,786,844 people shows a mild negative correlation between the proportion of Cubans and percentage of population with a disability between the ages 5 and 17 in the United States with a correlation coefficient (R) of -0.392 and weighted average of 5.3%. Similarly, the statistical analysis conducted on geographies consisting of 477,643,997 people shows a weak positive correlation between the proportion of Czechs and percentage of population with a disability between the ages 5 and 17 in the United States with a correlation coefficient (R) of 0.255 and weighted average of 5.8%, a difference of 8.2%.
Disability Age 5 to 17 Correlation Summary
| Measurement | Cuban | Czech |
| Minimum | 0.78% | 0.52% |
| Maximum | 9.3% | 45.5% |
| Range | 8.5% | 44.9% |
| Mean | 4.6% | 8.8% |
| Median | 4.9% | 6.2% |
| Interquartile 25% (IQ1) | 3.3% | 5.1% |
| Interquartile 75% (IQ3) | 5.9% | 9.3% |
| Interquartile Range (IQR) | 2.6% | 4.1% |
| Standard Deviation (Sample) | 1.8% | 7.5% |
| Standard Deviation (Population) | 1.8% | 7.5% |
Similar Demographics by Disability Age 5 to 17
Demographics Similar to Cubans by Disability Age 5 to 17
In terms of disability age 5 to 17, the demographic groups most similar to Cubans are Immigrants from Northern Europe (5.3%, a difference of 0.010%), Aleut (5.3%, a difference of 0.040%), Cypriot (5.3%, a difference of 0.060%), Immigrants from Latvia (5.3%, a difference of 0.080%), and Ethiopian (5.3%, a difference of 0.10%).
| Demographics | Rating | Rank | Disability Age 5 to 17 |
| Immigrants | South Africa | 98.1 /100 | #108 | Exceptional 5.3% |
| Immigrants | Northern Africa | 98.1 /100 | #109 | Exceptional 5.3% |
| Immigrants | Eritrea | 98.0 /100 | #110 | Exceptional 5.3% |
| Ethiopians | 97.9 /100 | #111 | Exceptional 5.3% |
| Immigrants | Latvia | 97.9 /100 | #112 | Exceptional 5.3% |
| Aleuts | 97.8 /100 | #113 | Exceptional 5.3% |
| Immigrants | Northern Europe | 97.8 /100 | #114 | Exceptional 5.3% |
| Cubans | 97.8 /100 | #115 | Exceptional 5.3% |
| Cypriots | 97.7 /100 | #116 | Exceptional 5.3% |
| Immigrants | Afghanistan | 97.4 /100 | #117 | Exceptional 5.3% |
| South Americans | 97.1 /100 | #118 | Exceptional 5.4% |
| Immigrants | South America | 97.1 /100 | #119 | Exceptional 5.4% |
| Immigrants | Immigrants | 97.0 /100 | #120 | Exceptional 5.4% |
| Maltese | 96.0 /100 | #121 | Exceptional 5.4% |
| Chileans | 95.8 /100 | #122 | Exceptional 5.4% |
Demographics Similar to Czechs by Disability Age 5 to 17
In terms of disability age 5 to 17, the demographic groups most similar to Czechs are Nigerian (5.8%, a difference of 0.030%), Immigrants from Sierra Leone (5.8%, a difference of 0.050%), Sierra Leonean (5.8%, a difference of 0.060%), Belgian (5.8%, a difference of 0.080%), and Swedish (5.8%, a difference of 0.12%).
| Demographics | Rating | Rank | Disability Age 5 to 17 |
| Immigrants | Haiti | 9.5 /100 | #210 | Tragic 5.8% |
| Yugoslavians | 9.1 /100 | #211 | Tragic 5.8% |
| Immigrants | Panama | 8.7 /100 | #212 | Tragic 5.8% |
| Immigrants | Cameroon | 8.3 /100 | #213 | Tragic 5.8% |
| Immigrants | Morocco | 8.3 /100 | #214 | Tragic 5.8% |
| Swedes | 8.1 /100 | #215 | Tragic 5.8% |
| Nigerians | 7.5 /100 | #216 | Tragic 5.8% |
| Czechs | 7.4 /100 | #217 | Tragic 5.8% |
| Immigrants | Sierra Leone | 7.1 /100 | #218 | Tragic 5.8% |
| Sierra Leoneans | 7.0 /100 | #219 | Tragic 5.8% |
| Belgians | 6.9 /100 | #220 | Tragic 5.8% |
| Lithuanians | 6.7 /100 | #221 | Tragic 5.8% |
| Immigrants | Sudan | 6.7 /100 | #222 | Tragic 5.8% |
| Alsatians | 6.0 /100 | #223 | Tragic 5.8% |
| Mexicans | 5.7 /100 | #224 | Tragic 5.8% |