Immigrants from Western Asia vs Immigrants from Uganda Male Disability
COMPARE
Immigrants from Western Asia
Immigrants from Uganda
Male Disability
Male Disability Comparison
Immigrants from Western Asia
Immigrants from Uganda
10.6%
MALE DISABILITY
97.8/ 100
METRIC RATING
88th/ 347
METRIC RANK
10.8%
MALE DISABILITY
94.0/ 100
METRIC RATING
109th/ 347
METRIC RANK
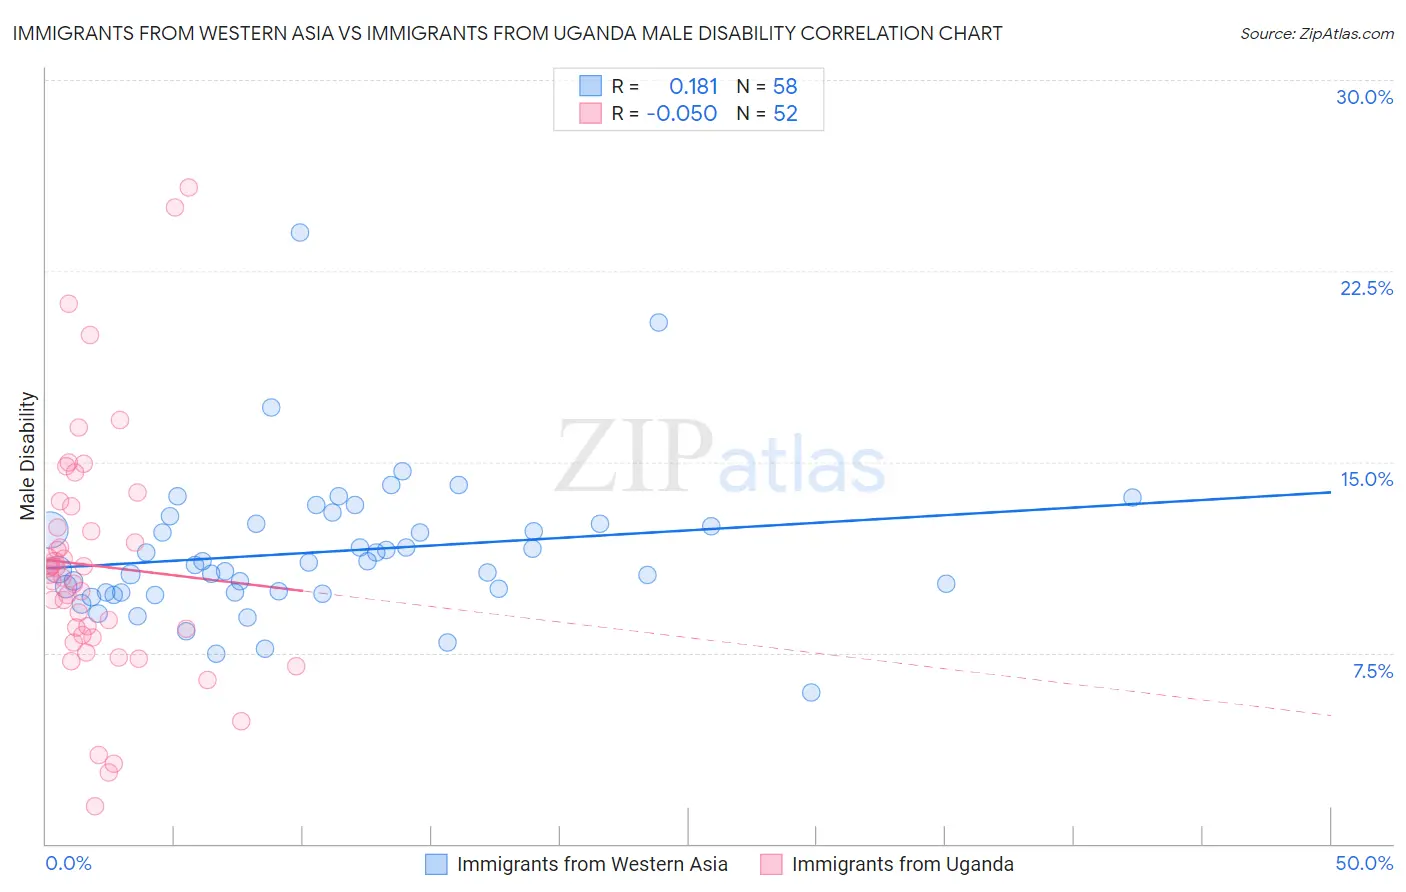
Immigrants from Western Asia vs Immigrants from Uganda Male Disability Correlation Chart
The statistical analysis conducted on geographies consisting of 404,415,030 people shows a poor positive correlation between the proportion of Immigrants from Western Asia and percentage of males with a disability in the United States with a correlation coefficient (R) of 0.181 and weighted average of 10.6%. Similarly, the statistical analysis conducted on geographies consisting of 125,978,860 people shows a slight negative correlation between the proportion of Immigrants from Uganda and percentage of males with a disability in the United States with a correlation coefficient (R) of -0.050 and weighted average of 10.8%, a difference of 1.5%.
Male Disability Correlation Summary
| Measurement | Immigrants from Western Asia | Immigrants from Uganda |
| Minimum | 5.9% | 1.5% |
| Maximum | 24.0% | 25.8% |
| Range | 18.1% | 24.3% |
| Mean | 11.5% | 10.9% |
| Median | 11.0% | 10.5% |
| Interquartile 25% (IQ1) | 9.9% | 8.2% |
| Interquartile 75% (IQ3) | 12.6% | 12.8% |
| Interquartile Range (IQR) | 2.7% | 4.7% |
| Standard Deviation (Sample) | 2.9% | 4.9% |
| Standard Deviation (Population) | 2.8% | 4.8% |
Similar Demographics by Male Disability
Demographics Similar to Immigrants from Western Asia by Male Disability
In terms of male disability, the demographic groups most similar to Immigrants from Western Asia are Immigrants from Nicaragua (10.6%, a difference of 0.0%), Immigrants from Morocco (10.6%, a difference of 0.050%), Immigrants from Vietnam (10.6%, a difference of 0.070%), Immigrants from Ireland (10.6%, a difference of 0.090%), and Immigrants from France (10.6%, a difference of 0.090%).
| Demographics | Rating | Rank | Male Disability |
| Immigrants | Chile | 98.3 /100 | #81 | Exceptional 10.6% |
| Immigrants | Guyana | 98.2 /100 | #82 | Exceptional 10.6% |
| Immigrants | Poland | 98.1 /100 | #83 | Exceptional 10.6% |
| Bulgarians | 98.1 /100 | #84 | Exceptional 10.6% |
| Sri Lankans | 97.9 /100 | #85 | Exceptional 10.6% |
| Immigrants | Ireland | 97.9 /100 | #86 | Exceptional 10.6% |
| Immigrants | Vietnam | 97.9 /100 | #87 | Exceptional 10.6% |
| Immigrants | Western Asia | 97.8 /100 | #88 | Exceptional 10.6% |
| Immigrants | Nicaragua | 97.8 /100 | #89 | Exceptional 10.6% |
| Immigrants | Morocco | 97.7 /100 | #90 | Exceptional 10.6% |
| Immigrants | France | 97.6 /100 | #91 | Exceptional 10.6% |
| Palestinians | 97.4 /100 | #92 | Exceptional 10.7% |
| Immigrants | St. Vincent and the Grenadines | 97.1 /100 | #93 | Exceptional 10.7% |
| Immigrants | Sweden | 96.9 /100 | #94 | Exceptional 10.7% |
| Chileans | 96.9 /100 | #95 | Exceptional 10.7% |
Demographics Similar to Immigrants from Uganda by Male Disability
In terms of male disability, the demographic groups most similar to Immigrants from Uganda are Immigrants (10.8%, a difference of 0.030%), Immigrants from Belgium (10.8%, a difference of 0.050%), Immigrants from Uruguay (10.8%, a difference of 0.060%), Immigrants from Eastern Africa (10.8%, a difference of 0.070%), and Ghanaian (10.8%, a difference of 0.16%).
| Demographics | Rating | Rank | Male Disability |
| Immigrants | Eastern Europe | 95.3 /100 | #102 | Exceptional 10.7% |
| Uruguayans | 95.3 /100 | #103 | Exceptional 10.7% |
| Immigrants | Nigeria | 95.1 /100 | #104 | Exceptional 10.8% |
| Immigrants | Brazil | 95.0 /100 | #105 | Exceptional 10.8% |
| Immigrants | Syria | 94.9 /100 | #106 | Exceptional 10.8% |
| Immigrants | Eastern Africa | 94.3 /100 | #107 | Exceptional 10.8% |
| Immigrants | Belgium | 94.2 /100 | #108 | Exceptional 10.8% |
| Immigrants | Uganda | 94.0 /100 | #109 | Exceptional 10.8% |
| Immigrants | Immigrants | 93.9 /100 | #110 | Exceptional 10.8% |
| Immigrants | Uruguay | 93.8 /100 | #111 | Exceptional 10.8% |
| Ghanaians | 93.4 /100 | #112 | Exceptional 10.8% |
| Immigrants | Zimbabwe | 93.0 /100 | #113 | Exceptional 10.8% |
| Central Americans | 92.7 /100 | #114 | Exceptional 10.8% |
| Immigrants | Barbados | 92.2 /100 | #115 | Exceptional 10.8% |
| Immigrants | South Africa | 91.8 /100 | #116 | Exceptional 10.8% |