Lithuanian vs Immigrants from Uganda Male Disability
COMPARE
Lithuanian
Immigrants from Uganda
Male Disability
Male Disability Comparison
Lithuanians
Immigrants from Uganda
11.6%
MALE DISABILITY
6.6/ 100
METRIC RATING
214th/ 347
METRIC RANK
10.8%
MALE DISABILITY
94.0/ 100
METRIC RATING
109th/ 347
METRIC RANK
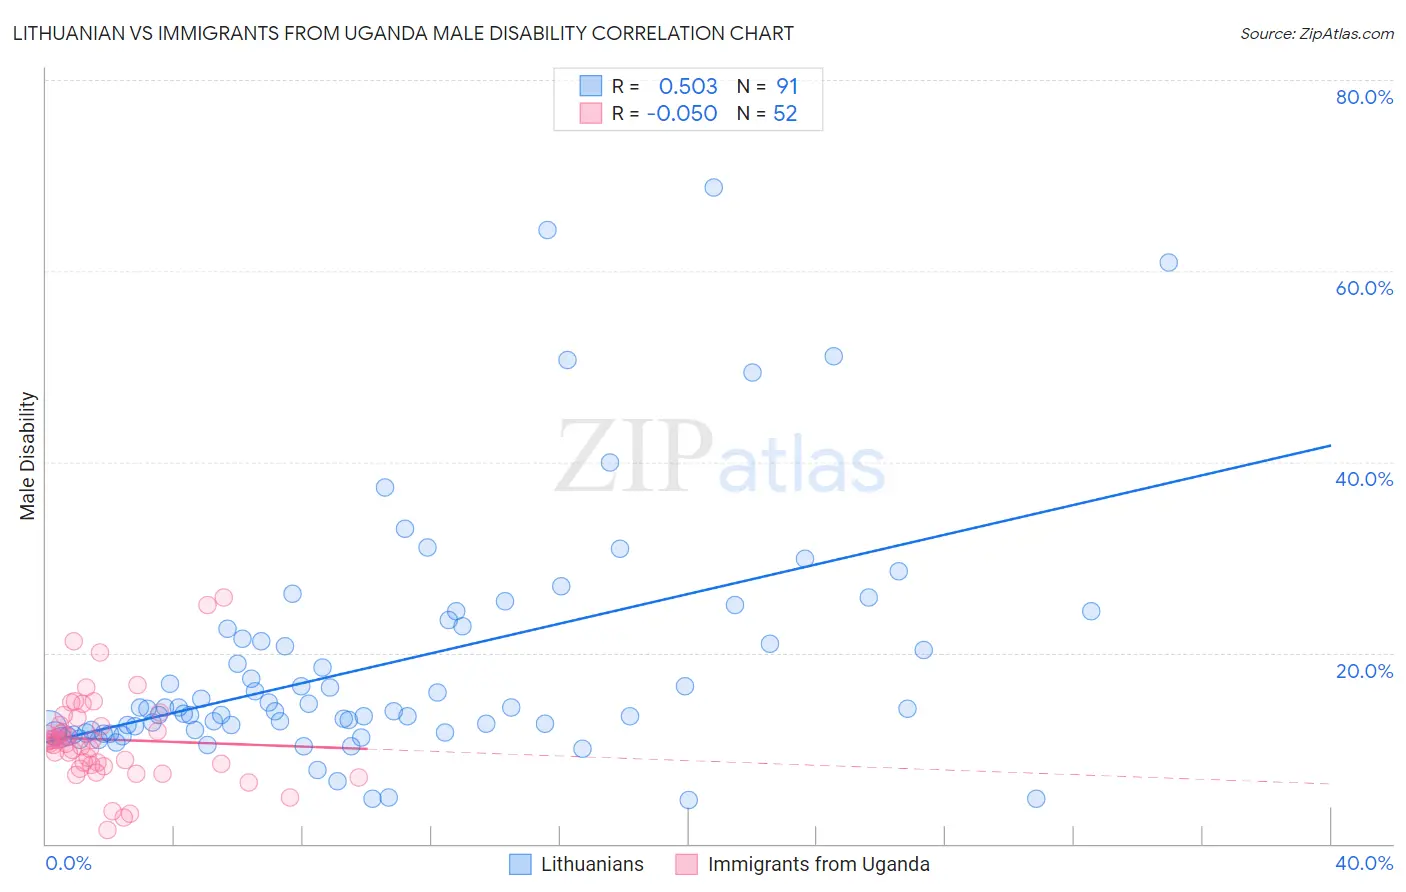
Lithuanian vs Immigrants from Uganda Male Disability Correlation Chart
The statistical analysis conducted on geographies consisting of 421,914,182 people shows a substantial positive correlation between the proportion of Lithuanians and percentage of males with a disability in the United States with a correlation coefficient (R) of 0.503 and weighted average of 11.6%. Similarly, the statistical analysis conducted on geographies consisting of 125,978,860 people shows a slight negative correlation between the proportion of Immigrants from Uganda and percentage of males with a disability in the United States with a correlation coefficient (R) of -0.050 and weighted average of 10.8%, a difference of 7.8%.
Male Disability Correlation Summary
| Measurement | Lithuanian | Immigrants from Uganda |
| Minimum | 4.5% | 1.5% |
| Maximum | 68.7% | 25.8% |
| Range | 64.1% | 24.3% |
| Mean | 18.8% | 10.9% |
| Median | 14.1% | 10.5% |
| Interquartile 25% (IQ1) | 11.6% | 8.2% |
| Interquartile 75% (IQ3) | 22.5% | 12.8% |
| Interquartile Range (IQR) | 10.9% | 4.7% |
| Standard Deviation (Sample) | 12.6% | 4.9% |
| Standard Deviation (Population) | 12.5% | 4.8% |
Similar Demographics by Male Disability
Demographics Similar to Lithuanians by Male Disability
In terms of male disability, the demographic groups most similar to Lithuanians are Indonesian (11.6%, a difference of 0.16%), Mexican American Indian (11.6%, a difference of 0.24%), Immigrants from Scotland (11.6%, a difference of 0.32%), Immigrants from Thailand (11.6%, a difference of 0.35%), and Immigrants from Dominican Republic (11.7%, a difference of 0.44%).
| Demographics | Rating | Rank | Male Disability |
| Immigrants | Somalia | 10.4 /100 | #207 | Poor 11.5% |
| Icelanders | 10.1 /100 | #208 | Poor 11.6% |
| Spanish American Indians | 10.1 /100 | #209 | Poor 11.6% |
| Ute | 9.4 /100 | #210 | Tragic 11.6% |
| Immigrants | Thailand | 8.4 /100 | #211 | Tragic 11.6% |
| Immigrants | Scotland | 8.2 /100 | #212 | Tragic 11.6% |
| Mexican American Indians | 7.8 /100 | #213 | Tragic 11.6% |
| Lithuanians | 6.6 /100 | #214 | Tragic 11.6% |
| Indonesians | 5.9 /100 | #215 | Tragic 11.6% |
| Immigrants | Dominican Republic | 4.9 /100 | #216 | Tragic 11.7% |
| Immigrants | Dominica | 4.6 /100 | #217 | Tragic 11.7% |
| Immigrants | England | 4.0 /100 | #218 | Tragic 11.7% |
| Panamanians | 3.8 /100 | #219 | Tragic 11.7% |
| Immigrants | Western Europe | 3.8 /100 | #220 | Tragic 11.7% |
| Immigrants | Congo | 3.7 /100 | #221 | Tragic 11.7% |
Demographics Similar to Immigrants from Uganda by Male Disability
In terms of male disability, the demographic groups most similar to Immigrants from Uganda are Immigrants (10.8%, a difference of 0.030%), Immigrants from Belgium (10.8%, a difference of 0.050%), Immigrants from Uruguay (10.8%, a difference of 0.060%), Immigrants from Eastern Africa (10.8%, a difference of 0.070%), and Ghanaian (10.8%, a difference of 0.16%).
| Demographics | Rating | Rank | Male Disability |
| Immigrants | Eastern Europe | 95.3 /100 | #102 | Exceptional 10.7% |
| Uruguayans | 95.3 /100 | #103 | Exceptional 10.7% |
| Immigrants | Nigeria | 95.1 /100 | #104 | Exceptional 10.8% |
| Immigrants | Brazil | 95.0 /100 | #105 | Exceptional 10.8% |
| Immigrants | Syria | 94.9 /100 | #106 | Exceptional 10.8% |
| Immigrants | Eastern Africa | 94.3 /100 | #107 | Exceptional 10.8% |
| Immigrants | Belgium | 94.2 /100 | #108 | Exceptional 10.8% |
| Immigrants | Uganda | 94.0 /100 | #109 | Exceptional 10.8% |
| Immigrants | Immigrants | 93.9 /100 | #110 | Exceptional 10.8% |
| Immigrants | Uruguay | 93.8 /100 | #111 | Exceptional 10.8% |
| Ghanaians | 93.4 /100 | #112 | Exceptional 10.8% |
| Immigrants | Zimbabwe | 93.0 /100 | #113 | Exceptional 10.8% |
| Central Americans | 92.7 /100 | #114 | Exceptional 10.8% |
| Immigrants | Barbados | 92.2 /100 | #115 | Exceptional 10.8% |
| Immigrants | South Africa | 91.8 /100 | #116 | Exceptional 10.8% |