Arab vs Tongan Disability
COMPARE
Arab
Tongan
Disability
Disability Comparison
Arabs
Tongans
11.4%
DISABILITY
89.1/ 100
METRIC RATING
133rd/ 347
METRIC RANK
10.8%
DISABILITY
99.9/ 100
METRIC RATING
46th/ 347
METRIC RANK
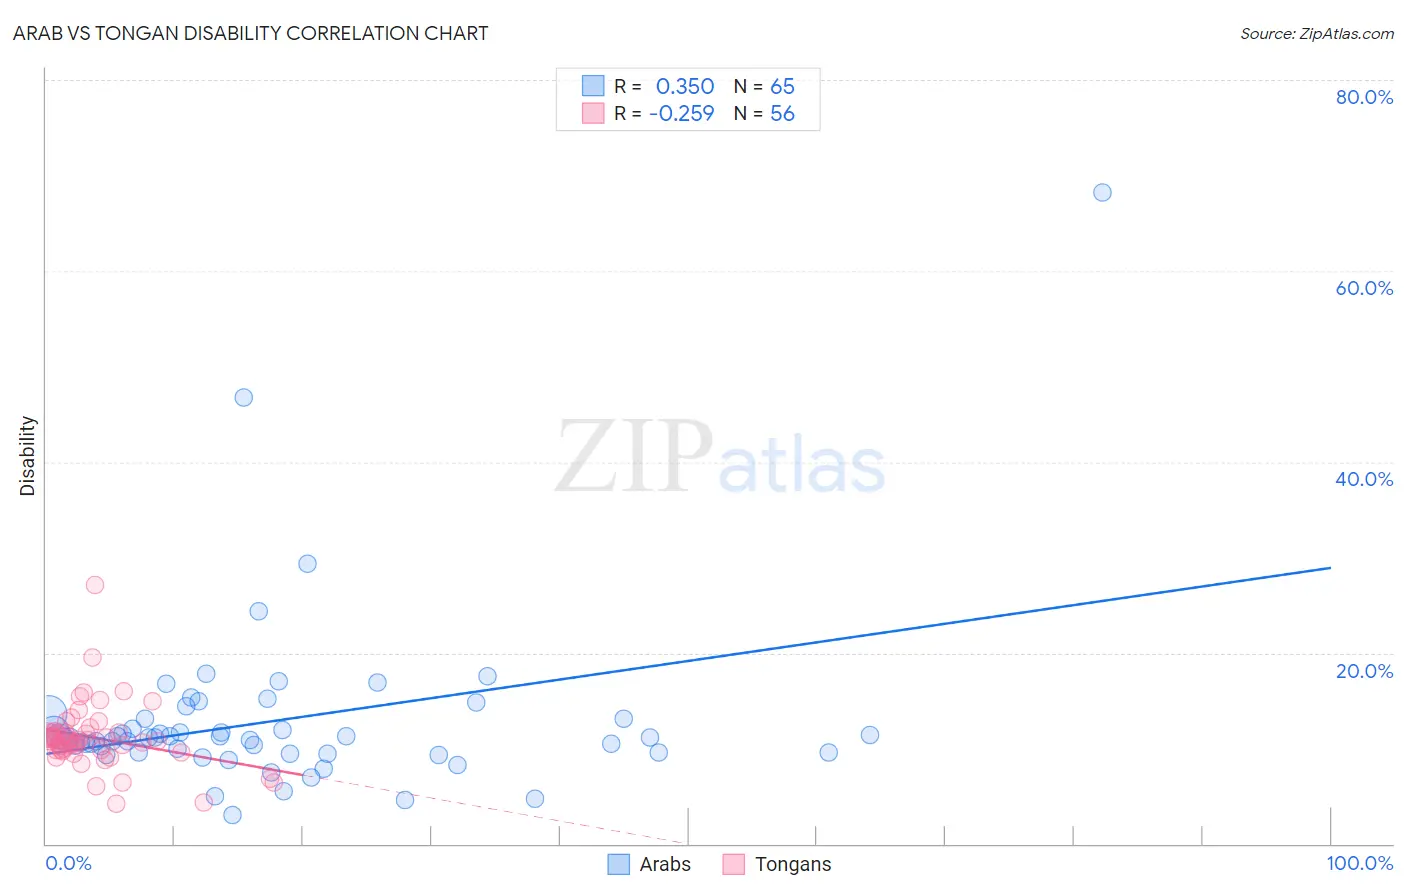
Arab vs Tongan Disability Correlation Chart
The statistical analysis conducted on geographies consisting of 486,795,543 people shows a mild positive correlation between the proportion of Arabs and percentage of population with a disability in the United States with a correlation coefficient (R) of 0.350 and weighted average of 11.4%. Similarly, the statistical analysis conducted on geographies consisting of 102,894,634 people shows a weak negative correlation between the proportion of Tongans and percentage of population with a disability in the United States with a correlation coefficient (R) of -0.259 and weighted average of 10.8%, a difference of 5.5%.
Disability Correlation Summary
| Measurement | Arab | Tongan |
| Minimum | 3.0% | 4.2% |
| Maximum | 68.2% | 27.1% |
| Range | 65.2% | 23.0% |
| Mean | 12.9% | 11.1% |
| Median | 11.1% | 10.8% |
| Interquartile 25% (IQ1) | 9.6% | 9.8% |
| Interquartile 75% (IQ3) | 13.1% | 11.7% |
| Interquartile Range (IQR) | 3.5% | 1.9% |
| Standard Deviation (Sample) | 9.2% | 3.5% |
| Standard Deviation (Population) | 9.1% | 3.5% |
Similar Demographics by Disability
Demographics Similar to Arabs by Disability
In terms of disability, the demographic groups most similar to Arabs are Immigrants from Africa (11.4%, a difference of 0.030%), Immigrants from Croatia (11.4%, a difference of 0.080%), Immigrants from Guyana (11.4%, a difference of 0.080%), Latvian (11.4%, a difference of 0.090%), and Ugandan (11.4%, a difference of 0.13%).
| Demographics | Rating | Rank | Disability |
| Immigrants | Latvia | 90.9 /100 | #126 | Exceptional 11.4% |
| Immigrants | Italy | 90.4 /100 | #127 | Exceptional 11.4% |
| Immigrants | Europe | 90.4 /100 | #128 | Exceptional 11.4% |
| Macedonians | 90.3 /100 | #129 | Exceptional 11.4% |
| Latvians | 89.8 /100 | #130 | Excellent 11.4% |
| Immigrants | Croatia | 89.8 /100 | #131 | Excellent 11.4% |
| Immigrants | Africa | 89.3 /100 | #132 | Excellent 11.4% |
| Arabs | 89.1 /100 | #133 | Excellent 11.4% |
| Immigrants | Guyana | 88.3 /100 | #134 | Excellent 11.4% |
| Ugandans | 87.9 /100 | #135 | Excellent 11.4% |
| Immigrants | St. Vincent and the Grenadines | 87.8 /100 | #136 | Excellent 11.4% |
| Kenyans | 87.1 /100 | #137 | Excellent 11.5% |
| New Zealanders | 87.0 /100 | #138 | Excellent 11.5% |
| Ghanaians | 87.0 /100 | #139 | Excellent 11.5% |
| Russians | 86.8 /100 | #140 | Excellent 11.5% |
Demographics Similar to Tongans by Disability
In terms of disability, the demographic groups most similar to Tongans are Immigrants from Peru (10.8%, a difference of 0.010%), Taiwanese (10.8%, a difference of 0.010%), Soviet Union (10.9%, a difference of 0.20%), Vietnamese (10.9%, a difference of 0.26%), and Immigrants from Saudi Arabia (10.9%, a difference of 0.26%).
| Demographics | Rating | Rank | Disability |
| Cambodians | 99.9 /100 | #39 | Exceptional 10.8% |
| Mongolians | 99.9 /100 | #40 | Exceptional 10.8% |
| Immigrants | Australia | 99.9 /100 | #41 | Exceptional 10.8% |
| Immigrants | Nepal | 99.9 /100 | #42 | Exceptional 10.8% |
| Israelis | 99.9 /100 | #43 | Exceptional 10.8% |
| Immigrants | Japan | 99.9 /100 | #44 | Exceptional 10.8% |
| Immigrants | Peru | 99.9 /100 | #45 | Exceptional 10.8% |
| Tongans | 99.9 /100 | #46 | Exceptional 10.8% |
| Taiwanese | 99.9 /100 | #47 | Exceptional 10.8% |
| Soviet Union | 99.9 /100 | #48 | Exceptional 10.9% |
| Vietnamese | 99.9 /100 | #49 | Exceptional 10.9% |
| Immigrants | Saudi Arabia | 99.9 /100 | #50 | Exceptional 10.9% |
| Peruvians | 99.8 /100 | #51 | Exceptional 10.9% |
| South Americans | 99.8 /100 | #52 | Exceptional 10.9% |
| Immigrants | Spain | 99.8 /100 | #53 | Exceptional 10.9% |