Croatian vs Tongan Female Unemployment
COMPARE
Croatian
Tongan
Female Unemployment
Female Unemployment Comparison
Croatians
Tongans
4.7%
FEMALE UNEMPLOYMENT
99.9/ 100
METRIC RATING
17th/ 347
METRIC RANK
4.8%
FEMALE UNEMPLOYMENT
99.5/ 100
METRIC RATING
41st/ 347
METRIC RANK
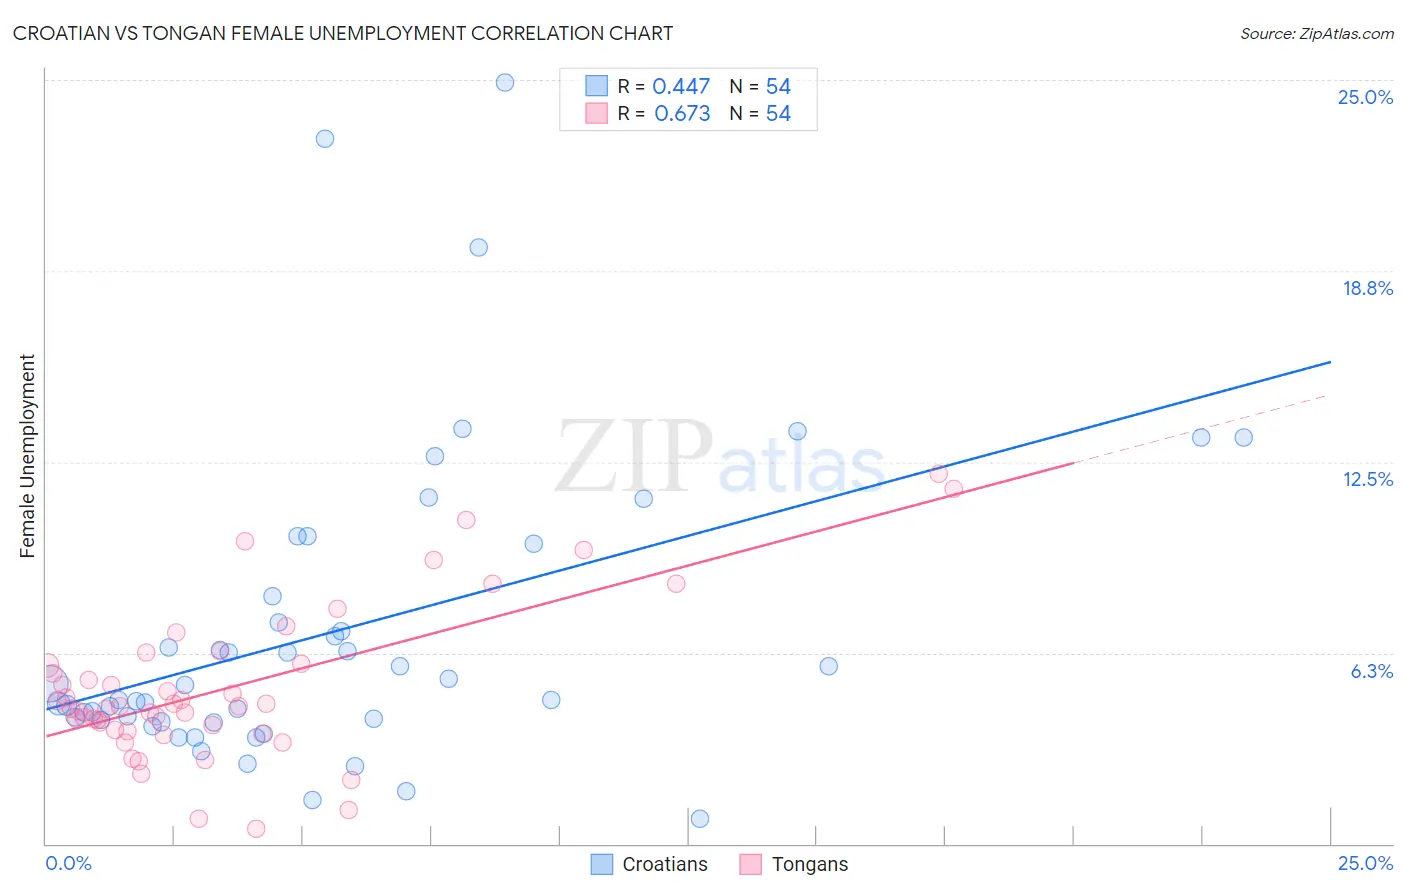
Croatian vs Tongan Female Unemployment Correlation Chart
The statistical analysis conducted on geographies consisting of 373,417,382 people shows a moderate positive correlation between the proportion of Croatians and unemploymnet rate among females in the United States with a correlation coefficient (R) of 0.447 and weighted average of 4.7%. Similarly, the statistical analysis conducted on geographies consisting of 102,722,911 people shows a significant positive correlation between the proportion of Tongans and unemploymnet rate among females in the United States with a correlation coefficient (R) of 0.673 and weighted average of 4.8%, a difference of 3.5%.
Female Unemployment Correlation Summary
| Measurement | Croatian | Tongan |
| Minimum | 0.80% | 0.50% |
| Maximum | 24.9% | 12.1% |
| Range | 24.1% | 11.6% |
| Mean | 6.9% | 5.1% |
| Median | 4.9% | 4.5% |
| Interquartile 25% (IQ1) | 4.1% | 3.7% |
| Interquartile 75% (IQ3) | 8.1% | 5.9% |
| Interquartile Range (IQR) | 4.0% | 2.2% |
| Standard Deviation (Sample) | 5.0% | 2.5% |
| Standard Deviation (Population) | 5.0% | 2.5% |
Similar Demographics by Female Unemployment
Demographics Similar to Croatians by Female Unemployment
In terms of female unemployment, the demographic groups most similar to Croatians are Carpatho Rusyn (4.7%, a difference of 0.020%), Latvian (4.7%, a difference of 0.14%), Polish (4.7%, a difference of 0.16%), Bulgarian (4.7%, a difference of 0.24%), and Fijian (4.7%, a difference of 0.25%).
| Demographics | Rating | Rank | Female Unemployment |
| Swiss | 100.0 /100 | #10 | Exceptional 4.6% |
| Scandinavians | 100.0 /100 | #11 | Exceptional 4.6% |
| Dutch | 100.0 /100 | #12 | Exceptional 4.6% |
| Belgians | 100.0 /100 | #13 | Exceptional 4.6% |
| Finns | 100.0 /100 | #14 | Exceptional 4.6% |
| English | 100.0 /100 | #15 | Exceptional 4.6% |
| Carpatho Rusyns | 99.9 /100 | #16 | Exceptional 4.7% |
| Croatians | 99.9 /100 | #17 | Exceptional 4.7% |
| Latvians | 99.9 /100 | #18 | Exceptional 4.7% |
| Poles | 99.9 /100 | #19 | Exceptional 4.7% |
| Bulgarians | 99.9 /100 | #20 | Exceptional 4.7% |
| Fijians | 99.9 /100 | #21 | Exceptional 4.7% |
| Europeans | 99.9 /100 | #22 | Exceptional 4.7% |
| Scottish | 99.9 /100 | #23 | Exceptional 4.7% |
| Welsh | 99.9 /100 | #24 | Exceptional 4.7% |
Demographics Similar to Tongans by Female Unemployment
In terms of female unemployment, the demographic groups most similar to Tongans are Italian (4.8%, a difference of 0.13%), French (4.8%, a difference of 0.26%), Scotch-Irish (4.8%, a difference of 0.30%), Northern European (4.8%, a difference of 0.31%), and Eastern European (4.9%, a difference of 0.31%).
| Demographics | Rating | Rank | Female Unemployment |
| Zimbabweans | 99.7 /100 | #34 | Exceptional 4.8% |
| French Canadians | 99.7 /100 | #35 | Exceptional 4.8% |
| Yugoslavians | 99.7 /100 | #36 | Exceptional 4.8% |
| Pennsylvania Germans | 99.6 /100 | #37 | Exceptional 4.8% |
| Northern Europeans | 99.6 /100 | #38 | Exceptional 4.8% |
| Scotch-Irish | 99.6 /100 | #39 | Exceptional 4.8% |
| French | 99.6 /100 | #40 | Exceptional 4.8% |
| Tongans | 99.5 /100 | #41 | Exceptional 4.8% |
| Italians | 99.5 /100 | #42 | Exceptional 4.8% |
| Eastern Europeans | 99.4 /100 | #43 | Exceptional 4.9% |
| Greeks | 99.4 /100 | #44 | Exceptional 4.9% |
| Austrians | 99.3 /100 | #45 | Exceptional 4.9% |
| Immigrants | Bulgaria | 99.3 /100 | #46 | Exceptional 4.9% |
| Okinawans | 99.3 /100 | #47 | Exceptional 4.9% |
| Thais | 99.2 /100 | #48 | Exceptional 4.9% |