Croatian vs Immigrants from Nepal Disability Age Under 5
COMPARE
Croatian
Immigrants from Nepal
Disability Age Under 5
Disability Age Under 5 Comparison
Croatians
Immigrants from Nepal
1.5%
DISABILITY AGE UNDER 5
0.0/ 100
METRIC RATING
285th/ 347
METRIC RANK
1.0%
DISABILITY AGE UNDER 5
99.9/ 100
METRIC RATING
36th/ 347
METRIC RANK
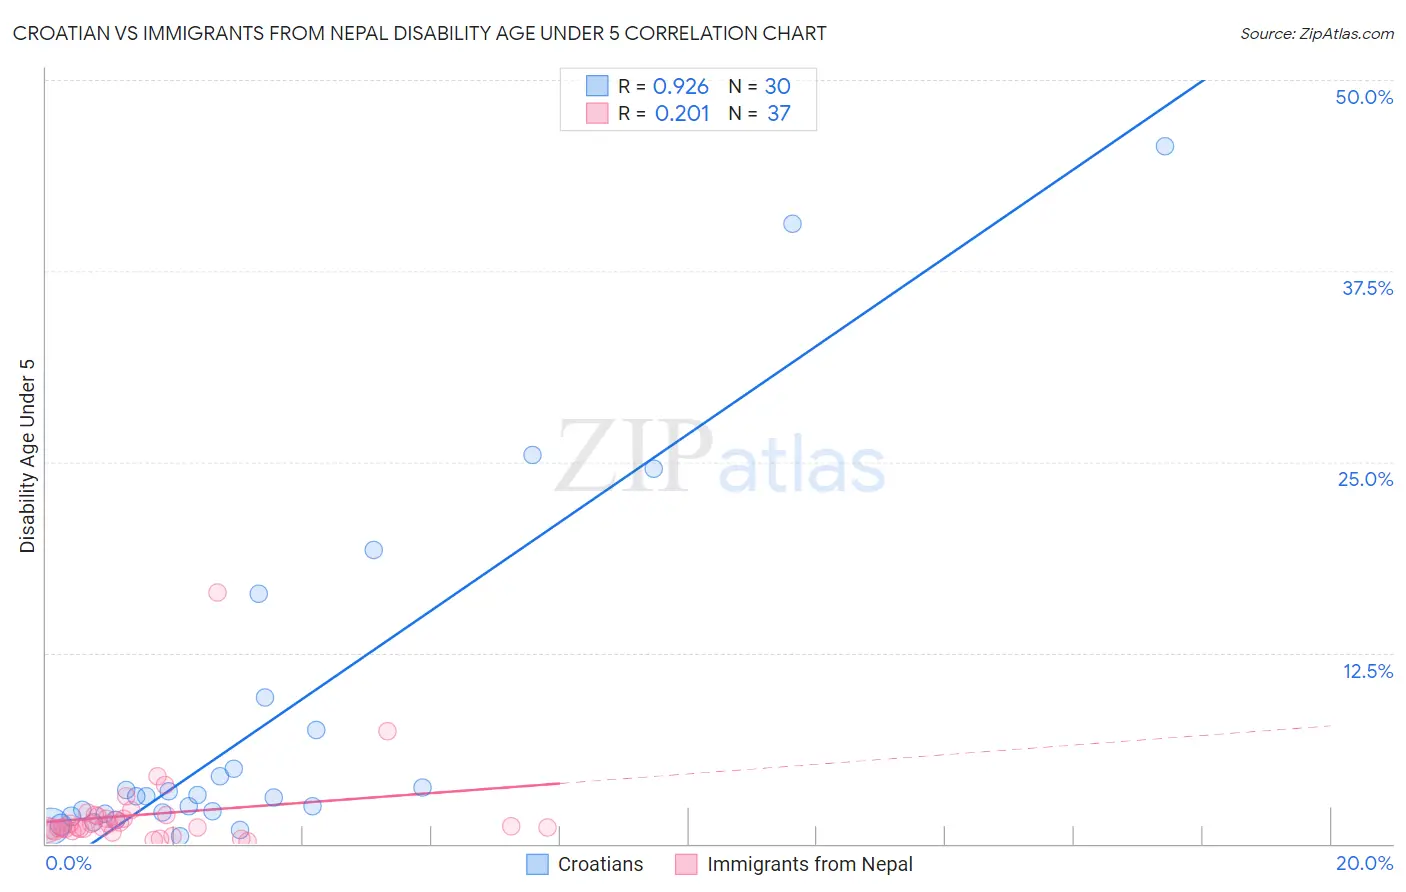
Croatian vs Immigrants from Nepal Disability Age Under 5 Correlation Chart
The statistical analysis conducted on geographies consisting of 201,433,787 people shows a near-perfect positive correlation between the proportion of Croatians and percentage of population with a disability under the age of 5 in the United States with a correlation coefficient (R) of 0.926 and weighted average of 1.5%. Similarly, the statistical analysis conducted on geographies consisting of 121,153,865 people shows a weak positive correlation between the proportion of Immigrants from Nepal and percentage of population with a disability under the age of 5 in the United States with a correlation coefficient (R) of 0.201 and weighted average of 1.0%, a difference of 47.3%.
Disability Age Under 5 Correlation Summary
| Measurement | Croatian | Immigrants from Nepal |
| Minimum | 0.50% | 0.17% |
| Maximum | 45.7% | 16.5% |
| Range | 45.2% | 16.3% |
| Mean | 8.1% | 1.9% |
| Median | 3.1% | 1.1% |
| Interquartile 25% (IQ1) | 1.9% | 0.92% |
| Interquartile 75% (IQ3) | 7.5% | 1.8% |
| Interquartile Range (IQR) | 5.5% | 0.92% |
| Standard Deviation (Sample) | 11.7% | 2.8% |
| Standard Deviation (Population) | 11.5% | 2.8% |
Similar Demographics by Disability Age Under 5
Demographics Similar to Croatians by Disability Age Under 5
In terms of disability age under 5, the demographic groups most similar to Croatians are Tlingit-Haida (1.5%, a difference of 0.25%), Scandinavian (1.5%, a difference of 0.30%), Estonian (1.5%, a difference of 0.49%), Hungarian (1.5%, a difference of 0.63%), and Czech (1.5%, a difference of 0.75%).
| Demographics | Rating | Rank | Disability Age Under 5 |
| Kiowa | 0.0 /100 | #278 | Tragic 1.5% |
| Danes | 0.0 /100 | #279 | Tragic 1.5% |
| British | 0.0 /100 | #280 | Tragic 1.5% |
| Czechoslovakians | 0.0 /100 | #281 | Tragic 1.5% |
| Cheyenne | 0.0 /100 | #282 | Tragic 1.5% |
| Delaware | 0.0 /100 | #283 | Tragic 1.5% |
| Europeans | 0.0 /100 | #284 | Tragic 1.5% |
| Croatians | 0.0 /100 | #285 | Tragic 1.5% |
| Tlingit-Haida | 0.0 /100 | #286 | Tragic 1.5% |
| Scandinavians | 0.0 /100 | #287 | Tragic 1.5% |
| Estonians | 0.0 /100 | #288 | Tragic 1.5% |
| Hungarians | 0.0 /100 | #289 | Tragic 1.5% |
| Czechs | 0.0 /100 | #290 | Tragic 1.5% |
| Northern Europeans | 0.0 /100 | #291 | Tragic 1.6% |
| Italians | 0.0 /100 | #292 | Tragic 1.6% |
Demographics Similar to Immigrants from Nepal by Disability Age Under 5
In terms of disability age under 5, the demographic groups most similar to Immigrants from Nepal are Immigrants from India (1.0%, a difference of 0.020%), Immigrants from Guyana (1.0%, a difference of 0.11%), Barbadian (1.0%, a difference of 0.71%), Filipino (1.1%, a difference of 0.78%), and Immigrants from Ukraine (1.0%, a difference of 0.95%).
| Demographics | Rating | Rank | Disability Age Under 5 |
| Immigrants | Belarus | 100.0 /100 | #29 | Exceptional 1.0% |
| Immigrants | South Central Asia | 99.9 /100 | #30 | Exceptional 1.0% |
| Armenians | 99.9 /100 | #31 | Exceptional 1.0% |
| Iranians | 99.9 /100 | #32 | Exceptional 1.0% |
| Bolivians | 99.9 /100 | #33 | Exceptional 1.0% |
| Immigrants | Ukraine | 99.9 /100 | #34 | Exceptional 1.0% |
| Barbadians | 99.9 /100 | #35 | Exceptional 1.0% |
| Immigrants | Nepal | 99.9 /100 | #36 | Exceptional 1.0% |
| Immigrants | India | 99.9 /100 | #37 | Exceptional 1.0% |
| Immigrants | Guyana | 99.9 /100 | #38 | Exceptional 1.0% |
| Filipinos | 99.9 /100 | #39 | Exceptional 1.1% |
| Immigrants | Albania | 99.9 /100 | #40 | Exceptional 1.1% |
| Thais | 99.8 /100 | #41 | Exceptional 1.1% |
| Immigrants | Bulgaria | 99.8 /100 | #42 | Exceptional 1.1% |
| Pima | 99.8 /100 | #43 | Exceptional 1.1% |