Croatian vs Immigrants from Cambodia Disability Age Under 5
COMPARE
Croatian
Immigrants from Cambodia
Disability Age Under 5
Disability Age Under 5 Comparison
Croatians
Immigrants from Cambodia
1.5%
DISABILITY AGE UNDER 5
0.0/ 100
METRIC RATING
285th/ 347
METRIC RANK
1.2%
DISABILITY AGE UNDER 5
90.5/ 100
METRIC RATING
124th/ 347
METRIC RANK
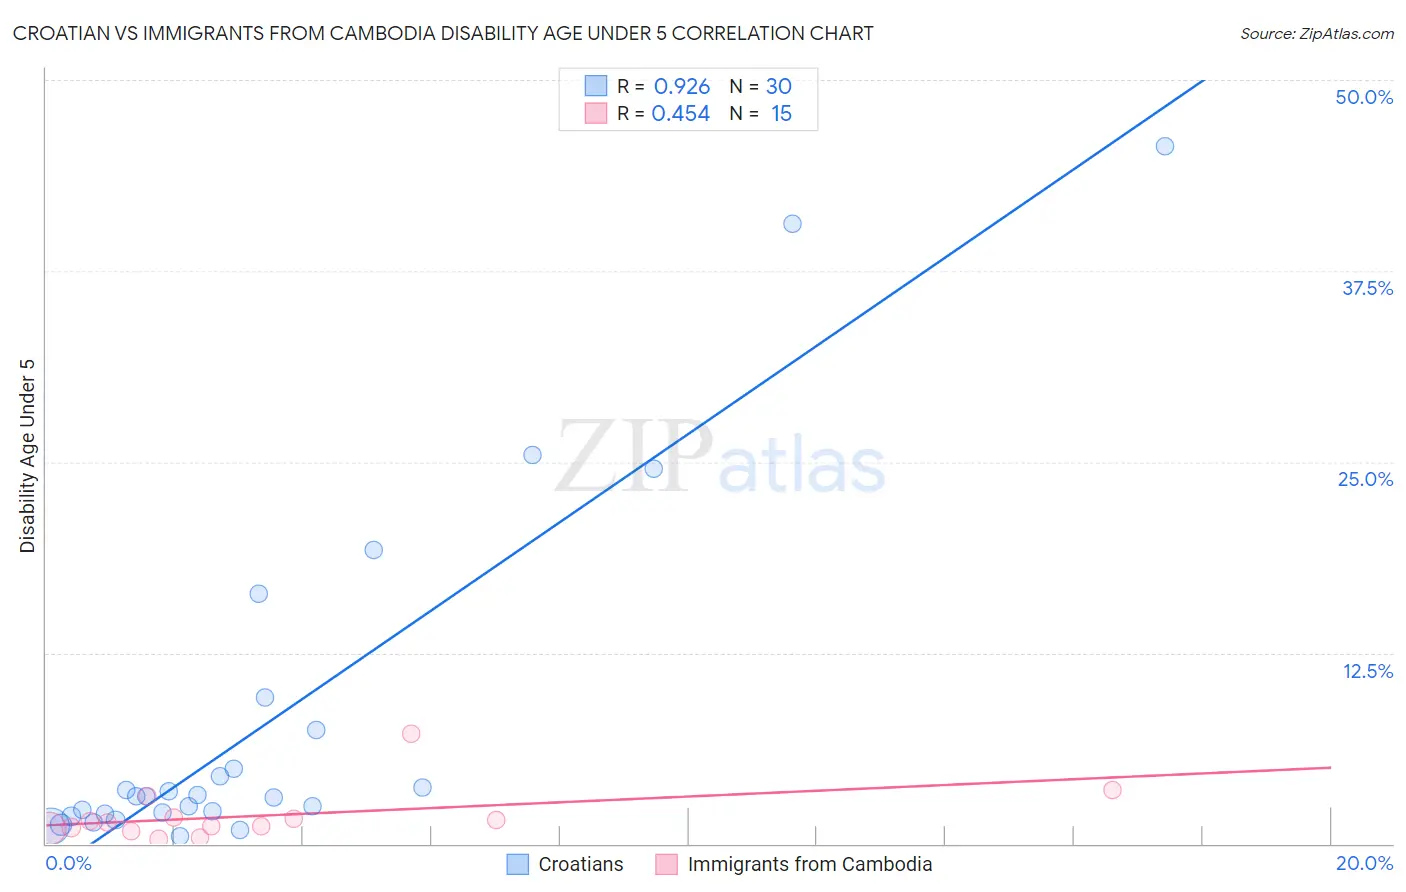
Croatian vs Immigrants from Cambodia Disability Age Under 5 Correlation Chart
The statistical analysis conducted on geographies consisting of 201,433,787 people shows a near-perfect positive correlation between the proportion of Croatians and percentage of population with a disability under the age of 5 in the United States with a correlation coefficient (R) of 0.926 and weighted average of 1.5%. Similarly, the statistical analysis conducted on geographies consisting of 138,793,023 people shows a moderate positive correlation between the proportion of Immigrants from Cambodia and percentage of population with a disability under the age of 5 in the United States with a correlation coefficient (R) of 0.454 and weighted average of 1.2%, a difference of 30.7%.
Disability Age Under 5 Correlation Summary
| Measurement | Croatian | Immigrants from Cambodia |
| Minimum | 0.50% | 0.29% |
| Maximum | 45.7% | 7.2% |
| Range | 45.2% | 6.9% |
| Mean | 8.1% | 1.8% |
| Median | 3.1% | 1.4% |
| Interquartile 25% (IQ1) | 1.9% | 0.98% |
| Interquartile 75% (IQ3) | 7.5% | 1.7% |
| Interquartile Range (IQR) | 5.5% | 0.75% |
| Standard Deviation (Sample) | 11.7% | 1.7% |
| Standard Deviation (Population) | 11.5% | 1.7% |
Similar Demographics by Disability Age Under 5
Demographics Similar to Croatians by Disability Age Under 5
In terms of disability age under 5, the demographic groups most similar to Croatians are Tlingit-Haida (1.5%, a difference of 0.25%), Scandinavian (1.5%, a difference of 0.30%), Estonian (1.5%, a difference of 0.49%), Hungarian (1.5%, a difference of 0.63%), and Czech (1.5%, a difference of 0.75%).
| Demographics | Rating | Rank | Disability Age Under 5 |
| Kiowa | 0.0 /100 | #278 | Tragic 1.5% |
| Danes | 0.0 /100 | #279 | Tragic 1.5% |
| British | 0.0 /100 | #280 | Tragic 1.5% |
| Czechoslovakians | 0.0 /100 | #281 | Tragic 1.5% |
| Cheyenne | 0.0 /100 | #282 | Tragic 1.5% |
| Delaware | 0.0 /100 | #283 | Tragic 1.5% |
| Europeans | 0.0 /100 | #284 | Tragic 1.5% |
| Croatians | 0.0 /100 | #285 | Tragic 1.5% |
| Tlingit-Haida | 0.0 /100 | #286 | Tragic 1.5% |
| Scandinavians | 0.0 /100 | #287 | Tragic 1.5% |
| Estonians | 0.0 /100 | #288 | Tragic 1.5% |
| Hungarians | 0.0 /100 | #289 | Tragic 1.5% |
| Czechs | 0.0 /100 | #290 | Tragic 1.5% |
| Northern Europeans | 0.0 /100 | #291 | Tragic 1.6% |
| Italians | 0.0 /100 | #292 | Tragic 1.6% |
Demographics Similar to Immigrants from Cambodia by Disability Age Under 5
In terms of disability age under 5, the demographic groups most similar to Immigrants from Cambodia are Zimbabwean (1.2%, a difference of 0.020%), Japanese (1.2%, a difference of 0.060%), Aleut (1.2%, a difference of 0.070%), Central American (1.2%, a difference of 0.22%), and Immigrants from Senegal (1.2%, a difference of 0.26%).
| Demographics | Rating | Rank | Disability Age Under 5 |
| Immigrants | Philippines | 93.5 /100 | #117 | Exceptional 1.2% |
| Immigrants | Venezuela | 93.4 /100 | #118 | Exceptional 1.2% |
| Bhutanese | 92.5 /100 | #119 | Exceptional 1.2% |
| Immigrants | Eritrea | 92.3 /100 | #120 | Exceptional 1.2% |
| Immigrants | Senegal | 91.4 /100 | #121 | Exceptional 1.2% |
| Aleuts | 90.7 /100 | #122 | Exceptional 1.2% |
| Zimbabweans | 90.6 /100 | #123 | Exceptional 1.2% |
| Immigrants | Cambodia | 90.5 /100 | #124 | Exceptional 1.2% |
| Japanese | 90.3 /100 | #125 | Exceptional 1.2% |
| Central Americans | 89.7 /100 | #126 | Excellent 1.2% |
| Immigrants | Romania | 88.4 /100 | #127 | Excellent 1.2% |
| Immigrants | France | 88.4 /100 | #128 | Excellent 1.2% |
| Immigrants | Immigrants | 88.0 /100 | #129 | Excellent 1.2% |
| Koreans | 87.7 /100 | #130 | Excellent 1.2% |
| Immigrants | Serbia | 87.6 /100 | #131 | Excellent 1.2% |