Croatian vs Immigrants from Albania Ambulatory Disability
COMPARE
Croatian
Immigrants from Albania
Ambulatory Disability
Ambulatory Disability Comparison
Croatians
Immigrants from Albania
6.1%
AMBULATORY DISABILITY
51.2/ 100
METRIC RATING
173rd/ 347
METRIC RANK
6.3%
AMBULATORY DISABILITY
9.6/ 100
METRIC RATING
220th/ 347
METRIC RANK
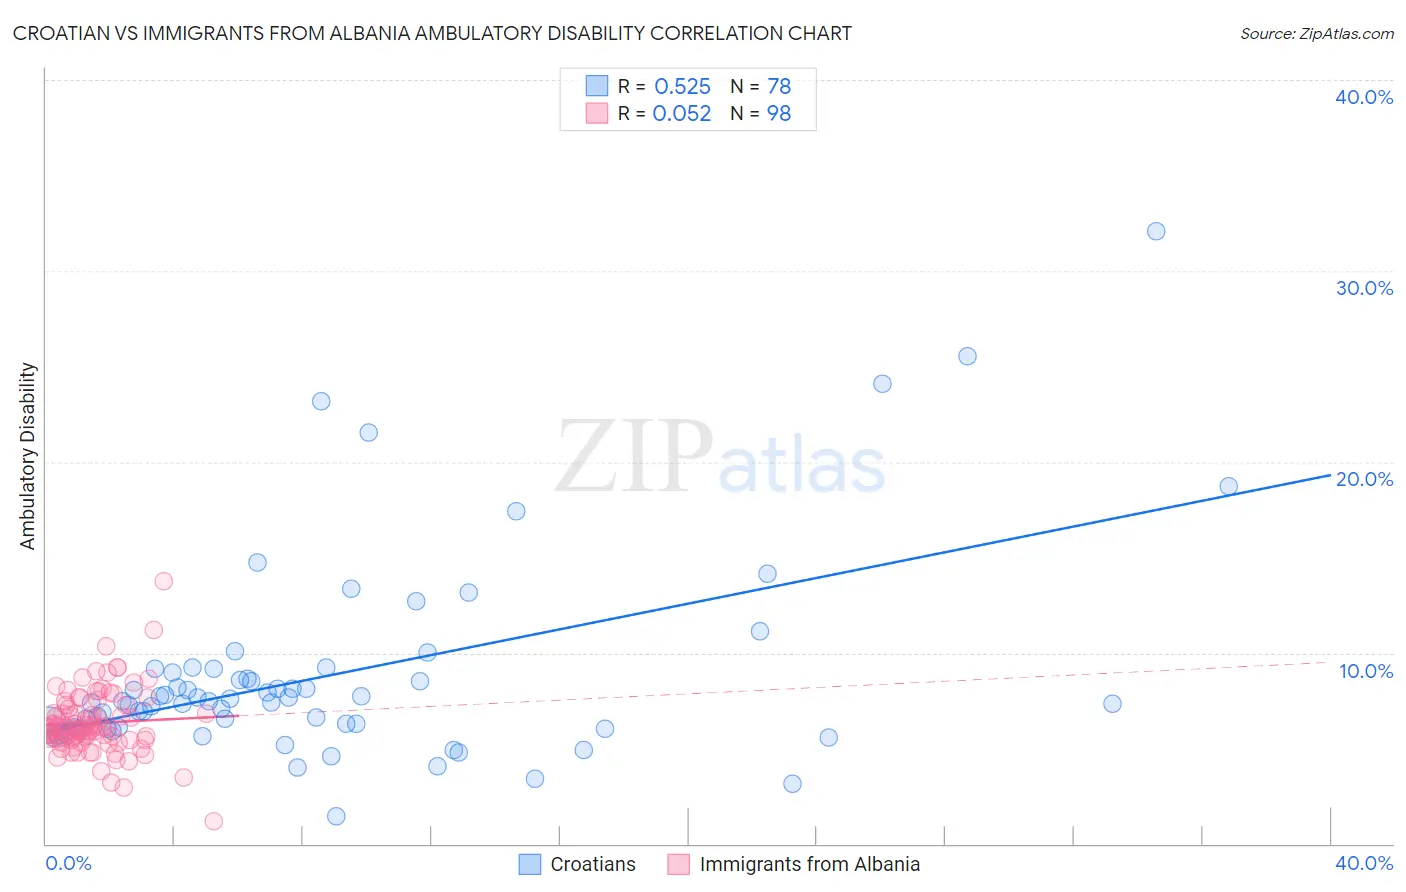
Croatian vs Immigrants from Albania Ambulatory Disability Correlation Chart
The statistical analysis conducted on geographies consisting of 375,651,055 people shows a substantial positive correlation between the proportion of Croatians and percentage of population with ambulatory disability in the United States with a correlation coefficient (R) of 0.525 and weighted average of 6.1%. Similarly, the statistical analysis conducted on geographies consisting of 119,394,227 people shows a slight positive correlation between the proportion of Immigrants from Albania and percentage of population with ambulatory disability in the United States with a correlation coefficient (R) of 0.052 and weighted average of 6.3%, a difference of 3.0%.
Ambulatory Disability Correlation Summary
| Measurement | Croatian | Immigrants from Albania |
| Minimum | 1.5% | 1.2% |
| Maximum | 32.1% | 13.8% |
| Range | 30.6% | 12.6% |
| Mean | 8.8% | 6.3% |
| Median | 7.4% | 6.0% |
| Interquartile 25% (IQ1) | 6.1% | 5.5% |
| Interquartile 75% (IQ3) | 8.9% | 7.1% |
| Interquartile Range (IQR) | 2.9% | 1.6% |
| Standard Deviation (Sample) | 5.3% | 1.7% |
| Standard Deviation (Population) | 5.2% | 1.7% |
Similar Demographics by Ambulatory Disability
Demographics Similar to Croatians by Ambulatory Disability
In terms of ambulatory disability, the demographic groups most similar to Croatians are Immigrants from Burma/Myanmar (6.1%, a difference of 0.050%), Immigrants from Canada (6.1%, a difference of 0.060%), Moroccan (6.1%, a difference of 0.080%), Immigrants from Ecuador (6.1%, a difference of 0.14%), and Vietnamese (6.1%, a difference of 0.21%).
| Demographics | Rating | Rank | Ambulatory Disability |
| Iraqis | 62.8 /100 | #166 | Good 6.1% |
| Immigrants | Oceania | 60.7 /100 | #167 | Good 6.1% |
| Ecuadorians | 60.5 /100 | #168 | Good 6.1% |
| Immigrants | Southern Europe | 58.1 /100 | #169 | Average 6.1% |
| Immigrants | Ecuador | 53.8 /100 | #170 | Average 6.1% |
| Moroccans | 52.6 /100 | #171 | Average 6.1% |
| Immigrants | Burma/Myanmar | 52.2 /100 | #172 | Average 6.1% |
| Croatians | 51.2 /100 | #173 | Average 6.1% |
| Immigrants | Canada | 50.0 /100 | #174 | Average 6.1% |
| Vietnamese | 47.2 /100 | #175 | Average 6.1% |
| Immigrants | North America | 45.6 /100 | #176 | Average 6.1% |
| Immigrants | England | 45.4 /100 | #177 | Average 6.1% |
| Scandinavians | 44.5 /100 | #178 | Average 6.1% |
| Austrians | 44.1 /100 | #179 | Average 6.1% |
| Immigrants | Nicaragua | 43.9 /100 | #180 | Average 6.1% |
Demographics Similar to Immigrants from Albania by Ambulatory Disability
In terms of ambulatory disability, the demographic groups most similar to Immigrants from Albania are Hungarian (6.3%, a difference of 0.010%), German Russian (6.3%, a difference of 0.030%), Indonesian (6.3%, a difference of 0.040%), Guamanian/Chamorro (6.3%, a difference of 0.13%), and Canadian (6.3%, a difference of 0.18%).
| Demographics | Rating | Rank | Ambulatory Disability |
| Japanese | 12.0 /100 | #213 | Poor 6.3% |
| Immigrants | Mexico | 11.0 /100 | #214 | Poor 6.3% |
| Immigrants | Latin America | 11.0 /100 | #215 | Poor 6.3% |
| Canadians | 10.9 /100 | #216 | Poor 6.3% |
| Yugoslavians | 10.9 /100 | #217 | Poor 6.3% |
| Guamanians/Chamorros | 10.6 /100 | #218 | Poor 6.3% |
| Indonesians | 9.9 /100 | #219 | Tragic 6.3% |
| Immigrants | Albania | 9.6 /100 | #220 | Tragic 6.3% |
| Hungarians | 9.6 /100 | #221 | Tragic 6.3% |
| German Russians | 9.4 /100 | #222 | Tragic 6.3% |
| Immigrants | Honduras | 7.6 /100 | #223 | Tragic 6.3% |
| Liberians | 7.1 /100 | #224 | Tragic 6.3% |
| Hondurans | 6.3 /100 | #225 | Tragic 6.3% |
| Slavs | 5.1 /100 | #226 | Tragic 6.4% |
| Cubans | 4.0 /100 | #227 | Tragic 6.4% |