Croatian vs Immigrants from Albania 8th Grade
COMPARE
Croatian
Immigrants from Albania
8th Grade
8th Grade Comparison
Croatians
Immigrants from Albania
97.2%
8TH GRADE
100.0/ 100
METRIC RATING
20th/ 347
METRIC RANK
95.7%
8TH GRADE
49.6/ 100
METRIC RATING
175th/ 347
METRIC RANK
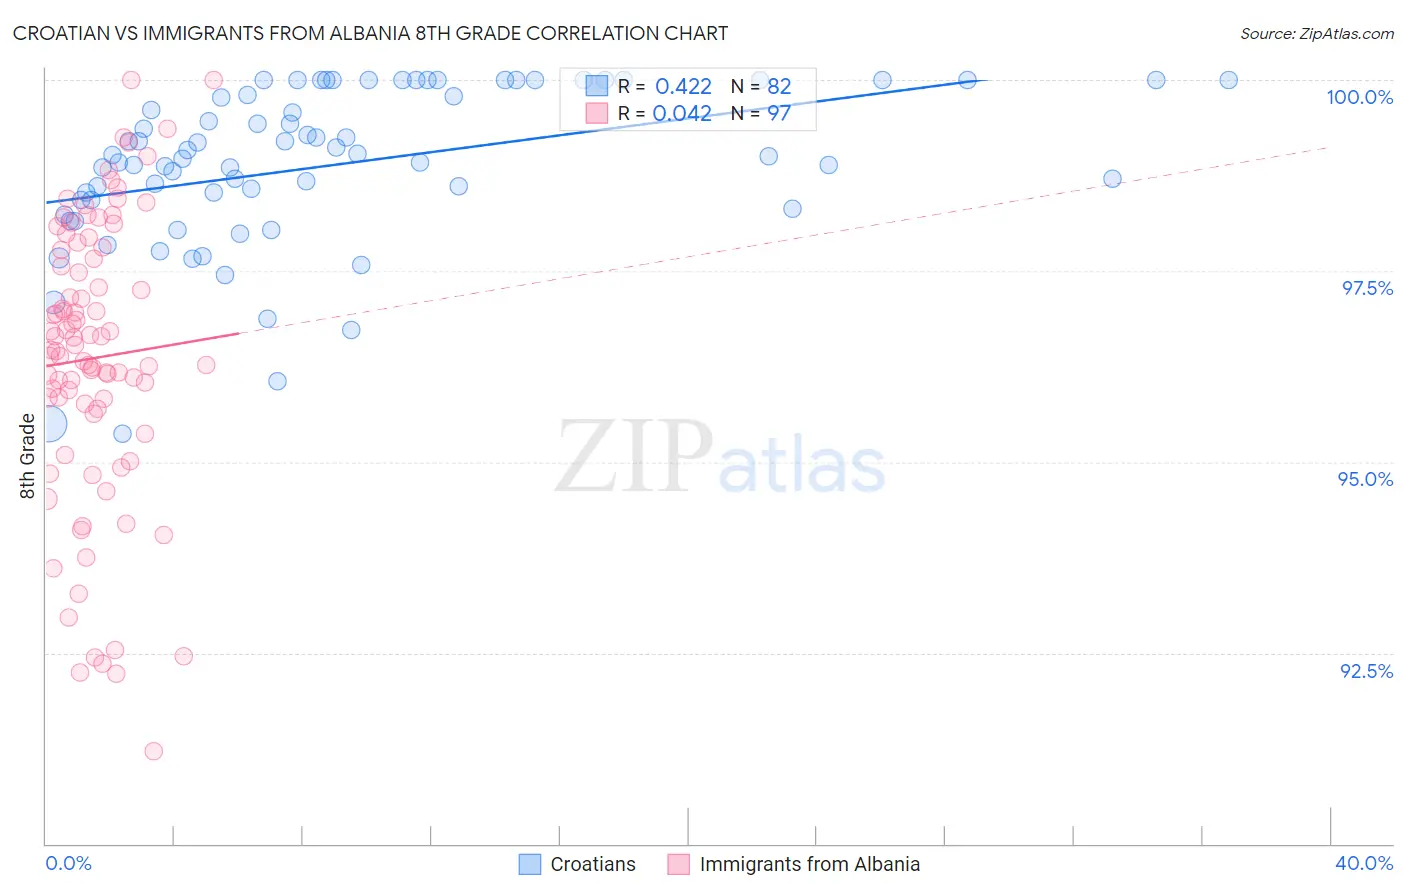
Croatian vs Immigrants from Albania 8th Grade Correlation Chart
The statistical analysis conducted on geographies consisting of 375,734,226 people shows a moderate positive correlation between the proportion of Croatians and percentage of population with at least 8th grade education in the United States with a correlation coefficient (R) of 0.422 and weighted average of 97.2%. Similarly, the statistical analysis conducted on geographies consisting of 119,265,453 people shows no correlation between the proportion of Immigrants from Albania and percentage of population with at least 8th grade education in the United States with a correlation coefficient (R) of 0.042 and weighted average of 95.7%, a difference of 1.5%.
8th Grade Correlation Summary
| Measurement | Croatian | Immigrants from Albania |
| Minimum | 95.4% | 91.2% |
| Maximum | 100.0% | 100.0% |
| Range | 4.6% | 8.8% |
| Mean | 98.9% | 96.4% |
| Median | 99.0% | 96.5% |
| Interquartile 25% (IQ1) | 98.4% | 95.7% |
| Interquartile 75% (IQ3) | 100.0% | 97.8% |
| Interquartile Range (IQR) | 1.6% | 2.1% |
| Standard Deviation (Sample) | 1.1% | 1.9% |
| Standard Deviation (Population) | 1.1% | 1.9% |
Similar Demographics by 8th Grade
Demographics Similar to Croatians by 8th Grade
In terms of 8th grade, the demographic groups most similar to Croatians are Danish (97.2%, a difference of 0.020%), Welsh (97.2%, a difference of 0.050%), Scottish (97.3%, a difference of 0.060%), French Canadian (97.2%, a difference of 0.060%), and Scandinavian (97.2%, a difference of 0.060%).
| Demographics | Rating | Rank | 8th Grade |
| Alaskan Athabascans | 100.0 /100 | #13 | Exceptional 97.3% |
| English | 100.0 /100 | #14 | Exceptional 97.3% |
| Pennsylvania Germans | 100.0 /100 | #15 | Exceptional 97.3% |
| Tlingit-Haida | 100.0 /100 | #16 | Exceptional 97.3% |
| Irish | 100.0 /100 | #17 | Exceptional 97.3% |
| Lithuanians | 100.0 /100 | #18 | Exceptional 97.3% |
| Scottish | 100.0 /100 | #19 | Exceptional 97.3% |
| Croatians | 100.0 /100 | #20 | Exceptional 97.2% |
| Danes | 100.0 /100 | #21 | Exceptional 97.2% |
| Welsh | 100.0 /100 | #22 | Exceptional 97.2% |
| French Canadians | 100.0 /100 | #23 | Exceptional 97.2% |
| Scandinavians | 100.0 /100 | #24 | Exceptional 97.2% |
| Czechs | 100.0 /100 | #25 | Exceptional 97.1% |
| French | 100.0 /100 | #26 | Exceptional 97.1% |
| Scotch-Irish | 100.0 /100 | #27 | Exceptional 97.1% |
Demographics Similar to Immigrants from Albania by 8th Grade
In terms of 8th grade, the demographic groups most similar to Immigrants from Albania are Chilean (95.7%, a difference of 0.0%), Pakistani (95.7%, a difference of 0.010%), Marshallese (95.7%, a difference of 0.010%), Venezuelan (95.7%, a difference of 0.010%), and Mongolian (95.8%, a difference of 0.020%).
| Demographics | Rating | Rank | 8th Grade |
| Immigrants | Ukraine | 59.5 /100 | #168 | Average 95.8% |
| Immigrants | Iran | 58.6 /100 | #169 | Average 95.8% |
| Ute | 58.5 /100 | #170 | Average 95.8% |
| Egyptians | 58.2 /100 | #171 | Average 95.8% |
| Immigrants | Korea | 57.9 /100 | #172 | Average 95.8% |
| Mongolians | 53.0 /100 | #173 | Average 95.8% |
| Chileans | 50.0 /100 | #174 | Average 95.7% |
| Immigrants | Albania | 49.6 /100 | #175 | Average 95.7% |
| Pakistanis | 48.8 /100 | #176 | Average 95.7% |
| Marshallese | 47.6 /100 | #177 | Average 95.7% |
| Venezuelans | 47.5 /100 | #178 | Average 95.7% |
| Immigrants | Brazil | 45.4 /100 | #179 | Average 95.7% |
| Iraqis | 40.5 /100 | #180 | Average 95.7% |
| Immigrants | Spain | 38.7 /100 | #181 | Fair 95.7% |
| Immigrants | Egypt | 37.9 /100 | #182 | Fair 95.7% |