Ukrainian vs Immigrants from Albania Ambulatory Disability
COMPARE
Ukrainian
Immigrants from Albania
Ambulatory Disability
Ambulatory Disability Comparison
Ukrainians
Immigrants from Albania
6.2%
AMBULATORY DISABILITY
34.0/ 100
METRIC RATING
189th/ 347
METRIC RANK
6.3%
AMBULATORY DISABILITY
9.6/ 100
METRIC RATING
220th/ 347
METRIC RANK
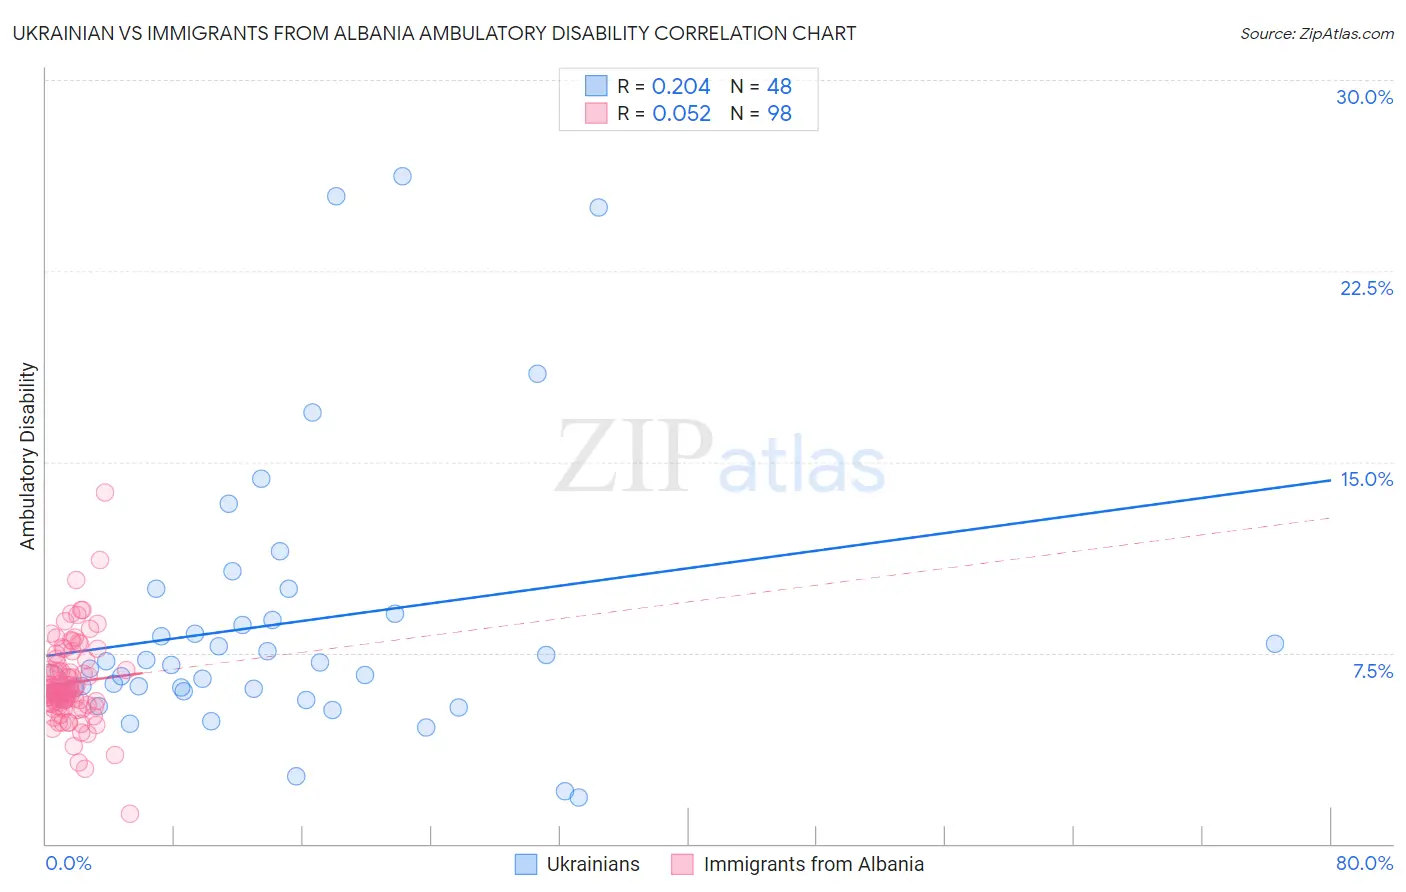
Ukrainian vs Immigrants from Albania Ambulatory Disability Correlation Chart
The statistical analysis conducted on geographies consisting of 448,487,424 people shows a weak positive correlation between the proportion of Ukrainians and percentage of population with ambulatory disability in the United States with a correlation coefficient (R) of 0.204 and weighted average of 6.2%. Similarly, the statistical analysis conducted on geographies consisting of 119,394,227 people shows a slight positive correlation between the proportion of Immigrants from Albania and percentage of population with ambulatory disability in the United States with a correlation coefficient (R) of 0.052 and weighted average of 6.3%, a difference of 2.1%.
Ambulatory Disability Correlation Summary
| Measurement | Ukrainian | Immigrants from Albania |
| Minimum | 1.8% | 1.2% |
| Maximum | 26.2% | 13.8% |
| Range | 24.4% | 12.6% |
| Mean | 8.6% | 6.3% |
| Median | 6.9% | 6.0% |
| Interquartile 25% (IQ1) | 5.9% | 5.5% |
| Interquartile 75% (IQ3) | 8.9% | 7.1% |
| Interquartile Range (IQR) | 3.0% | 1.6% |
| Standard Deviation (Sample) | 5.5% | 1.7% |
| Standard Deviation (Population) | 5.4% | 1.7% |
Similar Demographics by Ambulatory Disability
Demographics Similar to Ukrainians by Ambulatory Disability
In terms of ambulatory disability, the demographic groups most similar to Ukrainians are British (6.2%, a difference of 0.020%), Immigrants from Western Africa (6.2%, a difference of 0.040%), Carpatho Rusyn (6.2%, a difference of 0.080%), Immigrants from Guatemala (6.2%, a difference of 0.12%), and European (6.2%, a difference of 0.13%).
| Demographics | Rating | Rank | Ambulatory Disability |
| Serbians | 42.8 /100 | #182 | Average 6.1% |
| Immigrants | Thailand | 42.2 /100 | #183 | Average 6.1% |
| Immigrants | Ghana | 41.2 /100 | #184 | Average 6.1% |
| Immigrants | Bosnia and Herzegovina | 37.2 /100 | #185 | Fair 6.2% |
| Europeans | 36.2 /100 | #186 | Fair 6.2% |
| Carpatho Rusyns | 35.3 /100 | #187 | Fair 6.2% |
| British | 34.3 /100 | #188 | Fair 6.2% |
| Ukrainians | 34.0 /100 | #189 | Fair 6.2% |
| Immigrants | Western Africa | 33.4 /100 | #190 | Fair 6.2% |
| Immigrants | Guatemala | 31.9 /100 | #191 | Fair 6.2% |
| Immigrants | Western Europe | 31.6 /100 | #192 | Fair 6.2% |
| Guatemalans | 30.0 /100 | #193 | Fair 6.2% |
| Alaska Natives | 29.8 /100 | #194 | Fair 6.2% |
| Belgians | 28.6 /100 | #195 | Fair 6.2% |
| Malaysians | 28.2 /100 | #196 | Fair 6.2% |
Demographics Similar to Immigrants from Albania by Ambulatory Disability
In terms of ambulatory disability, the demographic groups most similar to Immigrants from Albania are Hungarian (6.3%, a difference of 0.010%), German Russian (6.3%, a difference of 0.030%), Indonesian (6.3%, a difference of 0.040%), Guamanian/Chamorro (6.3%, a difference of 0.13%), and Canadian (6.3%, a difference of 0.18%).
| Demographics | Rating | Rank | Ambulatory Disability |
| Japanese | 12.0 /100 | #213 | Poor 6.3% |
| Immigrants | Mexico | 11.0 /100 | #214 | Poor 6.3% |
| Immigrants | Latin America | 11.0 /100 | #215 | Poor 6.3% |
| Canadians | 10.9 /100 | #216 | Poor 6.3% |
| Yugoslavians | 10.9 /100 | #217 | Poor 6.3% |
| Guamanians/Chamorros | 10.6 /100 | #218 | Poor 6.3% |
| Indonesians | 9.9 /100 | #219 | Tragic 6.3% |
| Immigrants | Albania | 9.6 /100 | #220 | Tragic 6.3% |
| Hungarians | 9.6 /100 | #221 | Tragic 6.3% |
| German Russians | 9.4 /100 | #222 | Tragic 6.3% |
| Immigrants | Honduras | 7.6 /100 | #223 | Tragic 6.3% |
| Liberians | 7.1 /100 | #224 | Tragic 6.3% |
| Hondurans | 6.3 /100 | #225 | Tragic 6.3% |
| Slavs | 5.1 /100 | #226 | Tragic 6.4% |
| Cubans | 4.0 /100 | #227 | Tragic 6.4% |