Croatian vs Finnish Ambulatory Disability
COMPARE
Croatian
Finnish
Ambulatory Disability
Ambulatory Disability Comparison
Croatians
Finns
6.1%
AMBULATORY DISABILITY
51.2/ 100
METRIC RATING
173rd/ 347
METRIC RANK
6.2%
AMBULATORY DISABILITY
17.2/ 100
METRIC RATING
206th/ 347
METRIC RANK
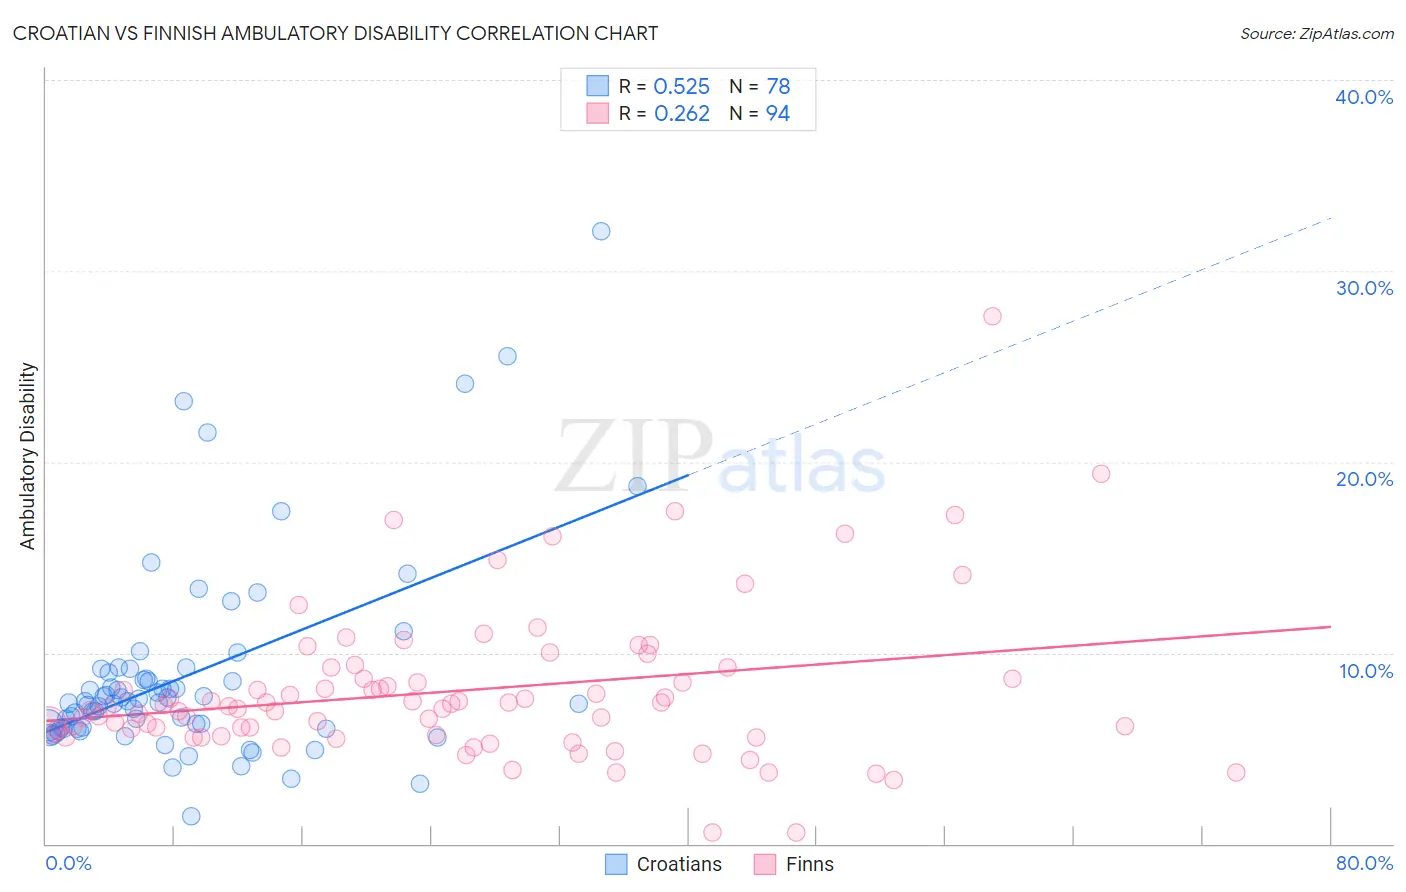
Croatian vs Finnish Ambulatory Disability Correlation Chart
The statistical analysis conducted on geographies consisting of 375,651,055 people shows a substantial positive correlation between the proportion of Croatians and percentage of population with ambulatory disability in the United States with a correlation coefficient (R) of 0.525 and weighted average of 6.1%. Similarly, the statistical analysis conducted on geographies consisting of 404,562,886 people shows a weak positive correlation between the proportion of Finns and percentage of population with ambulatory disability in the United States with a correlation coefficient (R) of 0.262 and weighted average of 6.2%, a difference of 2.1%.
Ambulatory Disability Correlation Summary
| Measurement | Croatian | Finnish |
| Minimum | 1.5% | 0.58% |
| Maximum | 32.1% | 27.6% |
| Range | 30.6% | 27.1% |
| Mean | 8.8% | 8.0% |
| Median | 7.4% | 7.2% |
| Interquartile 25% (IQ1) | 6.1% | 5.7% |
| Interquartile 75% (IQ3) | 8.9% | 8.6% |
| Interquartile Range (IQR) | 2.9% | 2.9% |
| Standard Deviation (Sample) | 5.3% | 4.0% |
| Standard Deviation (Population) | 5.2% | 4.0% |
Similar Demographics by Ambulatory Disability
Demographics Similar to Croatians by Ambulatory Disability
In terms of ambulatory disability, the demographic groups most similar to Croatians are Immigrants from Burma/Myanmar (6.1%, a difference of 0.050%), Immigrants from Canada (6.1%, a difference of 0.060%), Moroccan (6.1%, a difference of 0.080%), Immigrants from Ecuador (6.1%, a difference of 0.14%), and Vietnamese (6.1%, a difference of 0.21%).
| Demographics | Rating | Rank | Ambulatory Disability |
| Iraqis | 62.8 /100 | #166 | Good 6.1% |
| Immigrants | Oceania | 60.7 /100 | #167 | Good 6.1% |
| Ecuadorians | 60.5 /100 | #168 | Good 6.1% |
| Immigrants | Southern Europe | 58.1 /100 | #169 | Average 6.1% |
| Immigrants | Ecuador | 53.8 /100 | #170 | Average 6.1% |
| Moroccans | 52.6 /100 | #171 | Average 6.1% |
| Immigrants | Burma/Myanmar | 52.2 /100 | #172 | Average 6.1% |
| Croatians | 51.2 /100 | #173 | Average 6.1% |
| Immigrants | Canada | 50.0 /100 | #174 | Average 6.1% |
| Vietnamese | 47.2 /100 | #175 | Average 6.1% |
| Immigrants | North America | 45.6 /100 | #176 | Average 6.1% |
| Immigrants | England | 45.4 /100 | #177 | Average 6.1% |
| Scandinavians | 44.5 /100 | #178 | Average 6.1% |
| Austrians | 44.1 /100 | #179 | Average 6.1% |
| Immigrants | Nicaragua | 43.9 /100 | #180 | Average 6.1% |
Demographics Similar to Finns by Ambulatory Disability
In terms of ambulatory disability, the demographic groups most similar to Finns are Slovene (6.2%, a difference of 0.070%), Immigrants from Congo (6.2%, a difference of 0.090%), Immigrants from Ukraine (6.2%, a difference of 0.10%), Alsatian (6.3%, a difference of 0.21%), and Albanian (6.2%, a difference of 0.22%).
| Demographics | Rating | Rank | Ambulatory Disability |
| Italians | 22.6 /100 | #199 | Fair 6.2% |
| Immigrants | Cambodia | 21.5 /100 | #200 | Fair 6.2% |
| Immigrants | Central America | 20.1 /100 | #201 | Fair 6.2% |
| Albanians | 19.7 /100 | #202 | Poor 6.2% |
| Immigrants | Ukraine | 18.4 /100 | #203 | Poor 6.2% |
| Immigrants | Congo | 18.2 /100 | #204 | Poor 6.2% |
| Slovenes | 18.0 /100 | #205 | Poor 6.2% |
| Finns | 17.2 /100 | #206 | Poor 6.2% |
| Alsatians | 15.1 /100 | #207 | Poor 6.3% |
| Bangladeshis | 14.2 /100 | #208 | Poor 6.3% |
| Immigrants | Iraq | 14.0 /100 | #209 | Poor 6.3% |
| Immigrants | Laos | 13.2 /100 | #210 | Poor 6.3% |
| Samoans | 12.1 /100 | #211 | Poor 6.3% |
| Mexican American Indians | 12.0 /100 | #212 | Poor 6.3% |
| Japanese | 12.0 /100 | #213 | Poor 6.3% |