Croatian vs Korean Ambulatory Disability
COMPARE
Croatian
Korean
Ambulatory Disability
Ambulatory Disability Comparison
Croatians
Koreans
6.1%
AMBULATORY DISABILITY
51.2/ 100
METRIC RATING
173rd/ 347
METRIC RANK
5.9%
AMBULATORY DISABILITY
91.6/ 100
METRIC RATING
125th/ 347
METRIC RANK
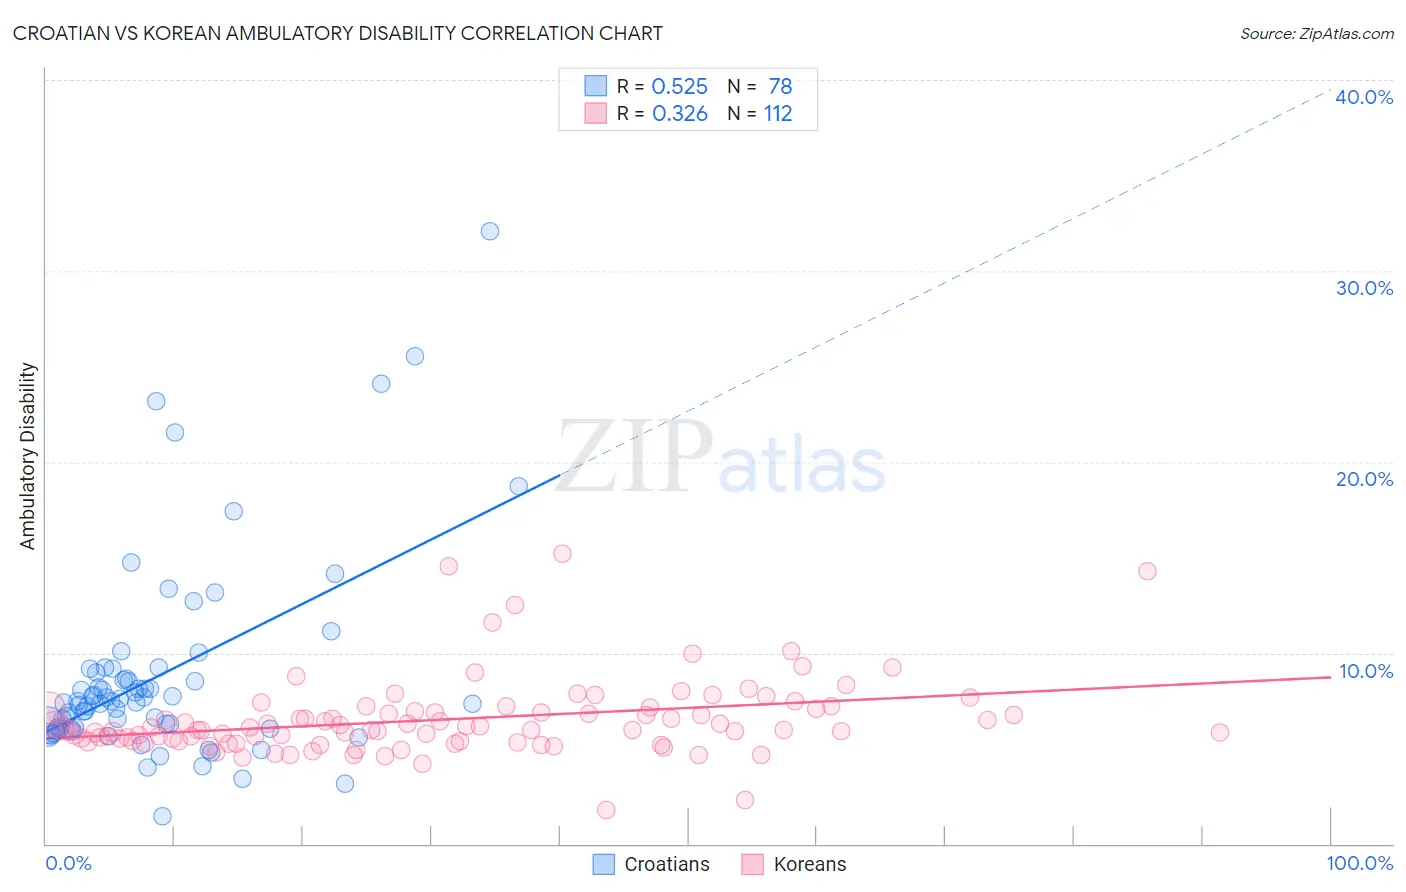
Croatian vs Korean Ambulatory Disability Correlation Chart
The statistical analysis conducted on geographies consisting of 375,651,055 people shows a substantial positive correlation between the proportion of Croatians and percentage of population with ambulatory disability in the United States with a correlation coefficient (R) of 0.525 and weighted average of 6.1%. Similarly, the statistical analysis conducted on geographies consisting of 510,581,293 people shows a mild positive correlation between the proportion of Koreans and percentage of population with ambulatory disability in the United States with a correlation coefficient (R) of 0.326 and weighted average of 5.9%, a difference of 3.2%.
Ambulatory Disability Correlation Summary
| Measurement | Croatian | Korean |
| Minimum | 1.5% | 1.8% |
| Maximum | 32.1% | 15.2% |
| Range | 30.6% | 13.4% |
| Mean | 8.8% | 6.5% |
| Median | 7.4% | 6.0% |
| Interquartile 25% (IQ1) | 6.1% | 5.4% |
| Interquartile 75% (IQ3) | 8.9% | 7.0% |
| Interquartile Range (IQR) | 2.9% | 1.6% |
| Standard Deviation (Sample) | 5.3% | 2.0% |
| Standard Deviation (Population) | 5.2% | 2.0% |
Similar Demographics by Ambulatory Disability
Demographics Similar to Croatians by Ambulatory Disability
In terms of ambulatory disability, the demographic groups most similar to Croatians are Immigrants from Burma/Myanmar (6.1%, a difference of 0.050%), Immigrants from Canada (6.1%, a difference of 0.060%), Moroccan (6.1%, a difference of 0.080%), Immigrants from Ecuador (6.1%, a difference of 0.14%), and Vietnamese (6.1%, a difference of 0.21%).
| Demographics | Rating | Rank | Ambulatory Disability |
| Iraqis | 62.8 /100 | #166 | Good 6.1% |
| Immigrants | Oceania | 60.7 /100 | #167 | Good 6.1% |
| Ecuadorians | 60.5 /100 | #168 | Good 6.1% |
| Immigrants | Southern Europe | 58.1 /100 | #169 | Average 6.1% |
| Immigrants | Ecuador | 53.8 /100 | #170 | Average 6.1% |
| Moroccans | 52.6 /100 | #171 | Average 6.1% |
| Immigrants | Burma/Myanmar | 52.2 /100 | #172 | Average 6.1% |
| Croatians | 51.2 /100 | #173 | Average 6.1% |
| Immigrants | Canada | 50.0 /100 | #174 | Average 6.1% |
| Vietnamese | 47.2 /100 | #175 | Average 6.1% |
| Immigrants | North America | 45.6 /100 | #176 | Average 6.1% |
| Immigrants | England | 45.4 /100 | #177 | Average 6.1% |
| Scandinavians | 44.5 /100 | #178 | Average 6.1% |
| Austrians | 44.1 /100 | #179 | Average 6.1% |
| Immigrants | Nicaragua | 43.9 /100 | #180 | Average 6.1% |
Demographics Similar to Koreans by Ambulatory Disability
In terms of ambulatory disability, the demographic groups most similar to Koreans are Arab (5.9%, a difference of 0.020%), Immigrants from Nigeria (5.9%, a difference of 0.11%), Immigrants from Middle Africa (5.9%, a difference of 0.12%), Immigrants from Western Asia (5.9%, a difference of 0.15%), and Immigrants from Russia (5.9%, a difference of 0.16%).
| Demographics | Rating | Rank | Ambulatory Disability |
| Russians | 93.4 /100 | #118 | Exceptional 5.9% |
| Norwegians | 93.1 /100 | #119 | Exceptional 5.9% |
| Estonians | 92.9 /100 | #120 | Exceptional 5.9% |
| Costa Ricans | 92.6 /100 | #121 | Exceptional 5.9% |
| Icelanders | 92.6 /100 | #122 | Exceptional 5.9% |
| Immigrants | Russia | 92.4 /100 | #123 | Exceptional 5.9% |
| Immigrants | Middle Africa | 92.2 /100 | #124 | Exceptional 5.9% |
| Koreans | 91.6 /100 | #125 | Exceptional 5.9% |
| Arabs | 91.5 /100 | #126 | Exceptional 5.9% |
| Immigrants | Nigeria | 90.9 /100 | #127 | Exceptional 5.9% |
| Immigrants | Western Asia | 90.7 /100 | #128 | Exceptional 5.9% |
| Immigrants | Norway | 90.5 /100 | #129 | Exceptional 5.9% |
| Immigrants | Kazakhstan | 89.7 /100 | #130 | Excellent 5.9% |
| Immigrants | Costa Rica | 89.5 /100 | #131 | Excellent 5.9% |
| Immigrants | Europe | 87.8 /100 | #132 | Excellent 6.0% |