Croatian vs Immigrants from Albania No Schooling Completed
COMPARE
Croatian
Immigrants from Albania
No Schooling Completed
No Schooling Completed Comparison
Croatians
Immigrants from Albania
1.5%
NO SCHOOLING COMPLETED
100.0/ 100
METRIC RATING
17th/ 347
METRIC RANK
2.2%
NO SCHOOLING COMPLETED
28.3/ 100
METRIC RATING
194th/ 347
METRIC RANK
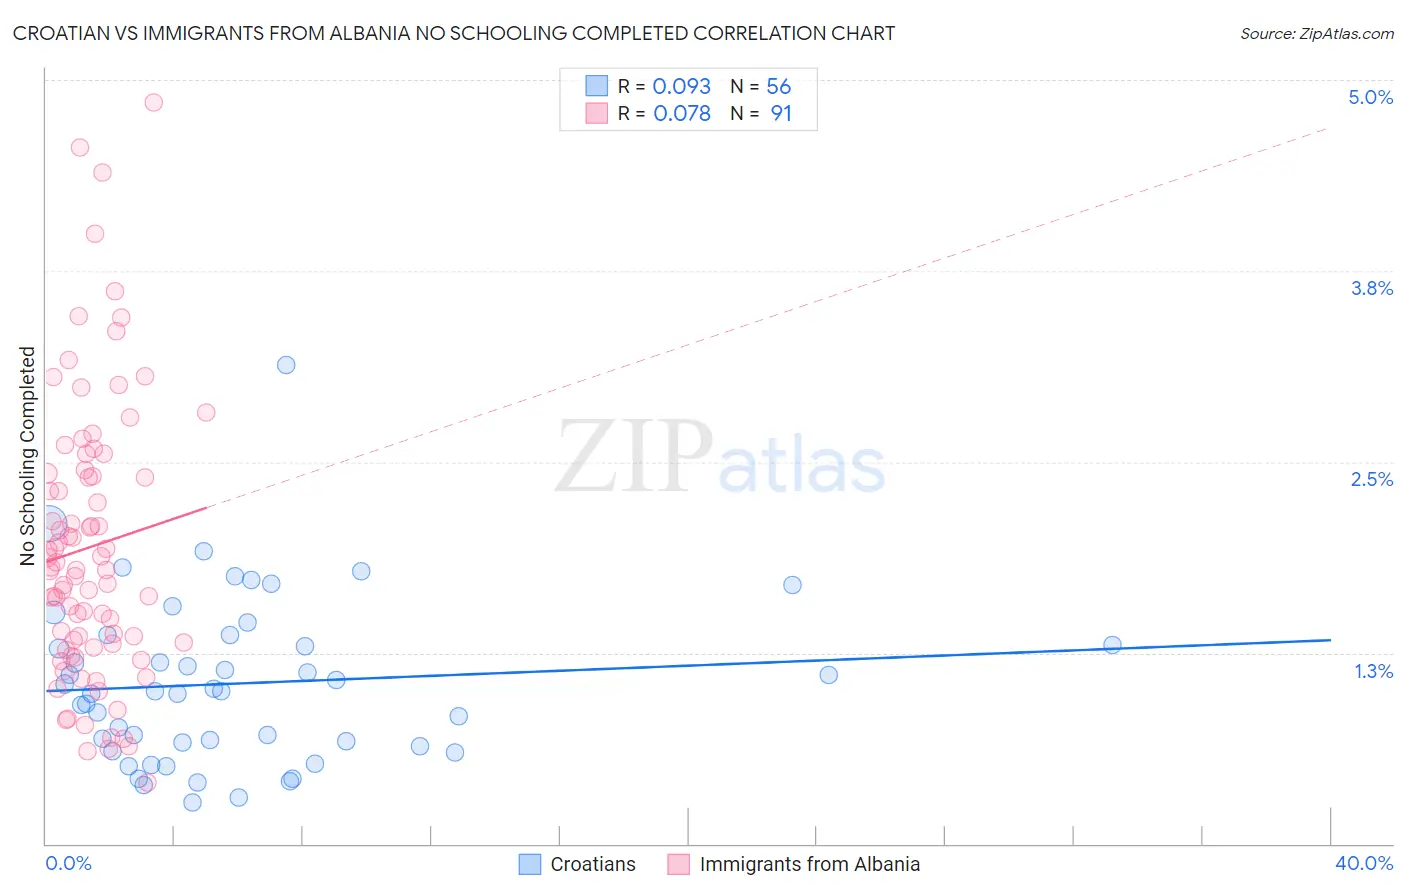
Croatian vs Immigrants from Albania No Schooling Completed Correlation Chart
The statistical analysis conducted on geographies consisting of 370,650,548 people shows a slight positive correlation between the proportion of Croatians and percentage of population with no schooling in the United States with a correlation coefficient (R) of 0.093 and weighted average of 1.5%. Similarly, the statistical analysis conducted on geographies consisting of 118,975,622 people shows a slight positive correlation between the proportion of Immigrants from Albania and percentage of population with no schooling in the United States with a correlation coefficient (R) of 0.078 and weighted average of 2.2%, a difference of 47.7%.
No Schooling Completed Correlation Summary
| Measurement | Croatian | Immigrants from Albania |
| Minimum | 0.27% | 0.40% |
| Maximum | 3.1% | 4.9% |
| Range | 2.9% | 4.5% |
| Mean | 1.0% | 1.9% |
| Median | 1.0% | 1.8% |
| Interquartile 25% (IQ1) | 0.65% | 1.3% |
| Interquartile 75% (IQ3) | 1.3% | 2.4% |
| Interquartile Range (IQR) | 0.68% | 1.1% |
| Standard Deviation (Sample) | 0.54% | 0.91% |
| Standard Deviation (Population) | 0.54% | 0.90% |
Similar Demographics by No Schooling Completed
Demographics Similar to Croatians by No Schooling Completed
In terms of no schooling completed, the demographic groups most similar to Croatians are Finnish (1.5%, a difference of 0.010%), Danish (1.5%, a difference of 0.30%), Alaskan Athabascan (1.5%, a difference of 0.41%), Tlingit-Haida (1.5%, a difference of 0.53%), and Welsh (1.5%, a difference of 0.53%).
| Demographics | Rating | Rank | No Schooling Completed |
| Dutch | 100.0 /100 | #10 | Exceptional 1.4% |
| Lithuanians | 100.0 /100 | #11 | Exceptional 1.4% |
| Irish | 100.0 /100 | #12 | Exceptional 1.4% |
| Poles | 100.0 /100 | #13 | Exceptional 1.4% |
| Scotch-Irish | 100.0 /100 | #14 | Exceptional 1.5% |
| Tlingit-Haida | 100.0 /100 | #15 | Exceptional 1.5% |
| Finns | 100.0 /100 | #16 | Exceptional 1.5% |
| Croatians | 100.0 /100 | #17 | Exceptional 1.5% |
| Danes | 100.0 /100 | #18 | Exceptional 1.5% |
| Alaskan Athabascans | 100.0 /100 | #19 | Exceptional 1.5% |
| Welsh | 100.0 /100 | #20 | Exceptional 1.5% |
| Chinese | 100.0 /100 | #21 | Exceptional 1.5% |
| Alaska Natives | 100.0 /100 | #22 | Exceptional 1.5% |
| Europeans | 100.0 /100 | #23 | Exceptional 1.5% |
| Pennsylvania Germans | 100.0 /100 | #24 | Exceptional 1.5% |
Demographics Similar to Immigrants from Albania by No Schooling Completed
In terms of no schooling completed, the demographic groups most similar to Immigrants from Albania are Paraguayan (2.2%, a difference of 0.17%), Hawaiian (2.2%, a difference of 0.20%), Guamanian/Chamorro (2.2%, a difference of 0.24%), Immigrants from Ukraine (2.2%, a difference of 0.35%), and Bermudan (2.1%, a difference of 0.38%).
| Demographics | Rating | Rank | No Schooling Completed |
| Navajo | 36.5 /100 | #187 | Fair 2.1% |
| Immigrants | Kenya | 36.2 /100 | #188 | Fair 2.1% |
| Immigrants | Egypt | 36.1 /100 | #189 | Fair 2.1% |
| Spanish Americans | 32.6 /100 | #190 | Fair 2.1% |
| Bermudans | 30.7 /100 | #191 | Fair 2.1% |
| Guamanians/Chamorros | 29.8 /100 | #192 | Fair 2.2% |
| Paraguayans | 29.3 /100 | #193 | Fair 2.2% |
| Immigrants | Albania | 28.3 /100 | #194 | Fair 2.2% |
| Hawaiians | 27.0 /100 | #195 | Fair 2.2% |
| Immigrants | Ukraine | 26.1 /100 | #196 | Fair 2.2% |
| Immigrants | Southern Europe | 23.8 /100 | #197 | Fair 2.2% |
| Immigrants | Chile | 22.7 /100 | #198 | Fair 2.2% |
| Africans | 21.8 /100 | #199 | Fair 2.2% |
| Immigrants | Northern Africa | 19.5 /100 | #200 | Poor 2.2% |
| Costa Ricans | 17.1 /100 | #201 | Poor 2.2% |