Malaysian vs Immigrants from Albania Ambulatory Disability
COMPARE
Malaysian
Immigrants from Albania
Ambulatory Disability
Ambulatory Disability Comparison
Malaysians
Immigrants from Albania
6.2%
AMBULATORY DISABILITY
28.2/ 100
METRIC RATING
196th/ 347
METRIC RANK
6.3%
AMBULATORY DISABILITY
9.6/ 100
METRIC RATING
220th/ 347
METRIC RANK
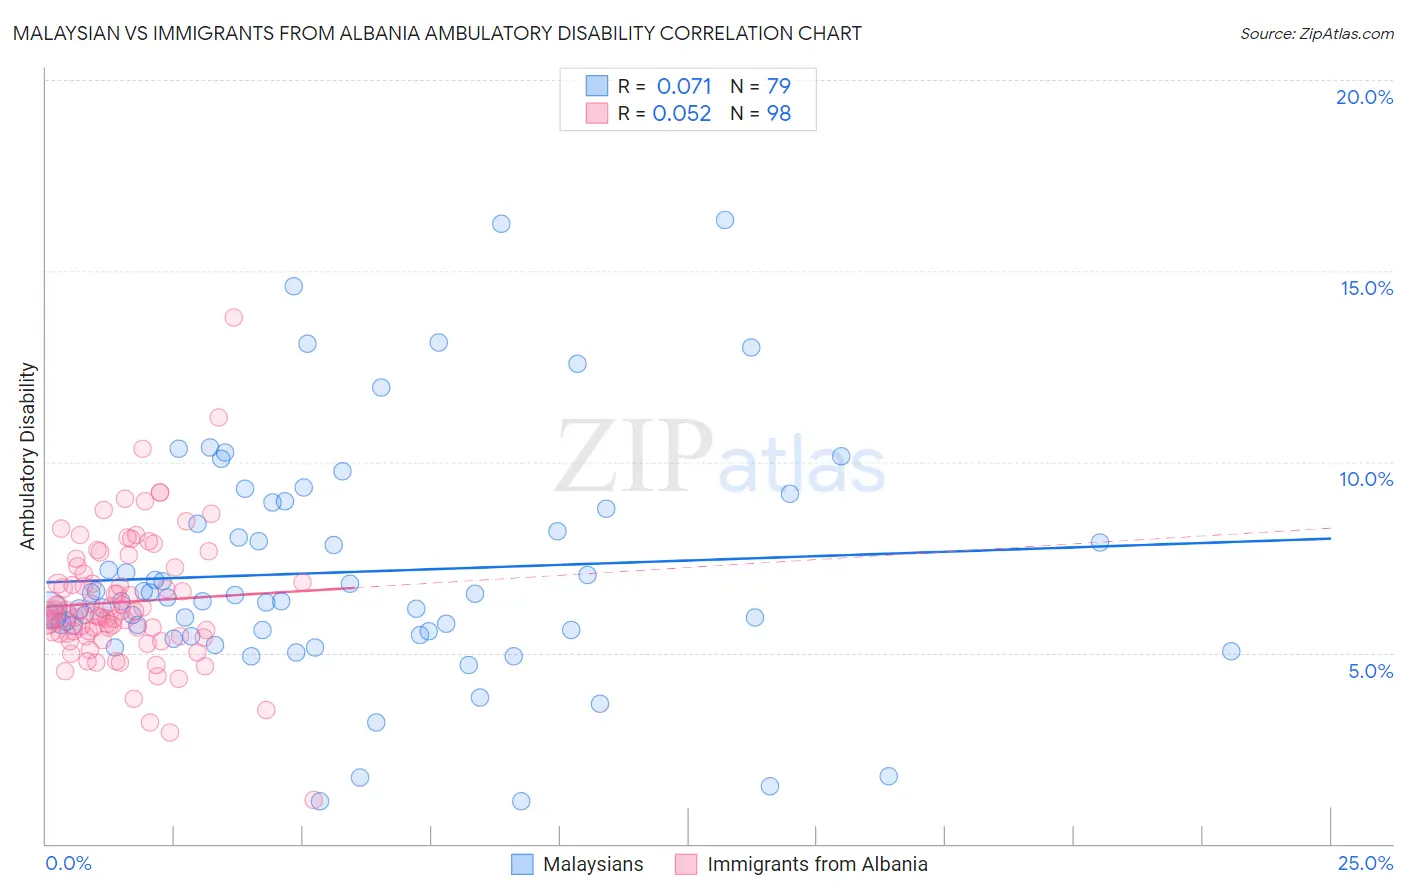
Malaysian vs Immigrants from Albania Ambulatory Disability Correlation Chart
The statistical analysis conducted on geographies consisting of 226,050,790 people shows a slight positive correlation between the proportion of Malaysians and percentage of population with ambulatory disability in the United States with a correlation coefficient (R) of 0.071 and weighted average of 6.2%. Similarly, the statistical analysis conducted on geographies consisting of 119,394,227 people shows a slight positive correlation between the proportion of Immigrants from Albania and percentage of population with ambulatory disability in the United States with a correlation coefficient (R) of 0.052 and weighted average of 6.3%, a difference of 1.7%.
Ambulatory Disability Correlation Summary
| Measurement | Malaysian | Immigrants from Albania |
| Minimum | 1.1% | 1.2% |
| Maximum | 16.3% | 13.8% |
| Range | 15.2% | 12.6% |
| Mean | 7.1% | 6.3% |
| Median | 6.4% | 6.0% |
| Interquartile 25% (IQ1) | 5.6% | 5.5% |
| Interquartile 75% (IQ3) | 8.8% | 7.1% |
| Interquartile Range (IQR) | 3.2% | 1.6% |
| Standard Deviation (Sample) | 3.1% | 1.7% |
| Standard Deviation (Population) | 3.1% | 1.7% |
Similar Demographics by Ambulatory Disability
Demographics Similar to Malaysians by Ambulatory Disability
In terms of ambulatory disability, the demographic groups most similar to Malaysians are Belgian (6.2%, a difference of 0.030%), Alaska Native (6.2%, a difference of 0.10%), Guatemalan (6.2%, a difference of 0.11%), Polish (6.2%, a difference of 0.12%), and Immigrants from Western Europe (6.2%, a difference of 0.21%).
| Demographics | Rating | Rank | Ambulatory Disability |
| Ukrainians | 34.0 /100 | #189 | Fair 6.2% |
| Immigrants | Western Africa | 33.4 /100 | #190 | Fair 6.2% |
| Immigrants | Guatemala | 31.9 /100 | #191 | Fair 6.2% |
| Immigrants | Western Europe | 31.6 /100 | #192 | Fair 6.2% |
| Guatemalans | 30.0 /100 | #193 | Fair 6.2% |
| Alaska Natives | 29.8 /100 | #194 | Fair 6.2% |
| Belgians | 28.6 /100 | #195 | Fair 6.2% |
| Malaysians | 28.2 /100 | #196 | Fair 6.2% |
| Poles | 26.3 /100 | #197 | Fair 6.2% |
| Immigrants | Bangladesh | 24.6 /100 | #198 | Fair 6.2% |
| Italians | 22.6 /100 | #199 | Fair 6.2% |
| Immigrants | Cambodia | 21.5 /100 | #200 | Fair 6.2% |
| Immigrants | Central America | 20.1 /100 | #201 | Fair 6.2% |
| Albanians | 19.7 /100 | #202 | Poor 6.2% |
| Immigrants | Ukraine | 18.4 /100 | #203 | Poor 6.2% |
Demographics Similar to Immigrants from Albania by Ambulatory Disability
In terms of ambulatory disability, the demographic groups most similar to Immigrants from Albania are Hungarian (6.3%, a difference of 0.010%), German Russian (6.3%, a difference of 0.030%), Indonesian (6.3%, a difference of 0.040%), Guamanian/Chamorro (6.3%, a difference of 0.13%), and Canadian (6.3%, a difference of 0.18%).
| Demographics | Rating | Rank | Ambulatory Disability |
| Japanese | 12.0 /100 | #213 | Poor 6.3% |
| Immigrants | Mexico | 11.0 /100 | #214 | Poor 6.3% |
| Immigrants | Latin America | 11.0 /100 | #215 | Poor 6.3% |
| Canadians | 10.9 /100 | #216 | Poor 6.3% |
| Yugoslavians | 10.9 /100 | #217 | Poor 6.3% |
| Guamanians/Chamorros | 10.6 /100 | #218 | Poor 6.3% |
| Indonesians | 9.9 /100 | #219 | Tragic 6.3% |
| Immigrants | Albania | 9.6 /100 | #220 | Tragic 6.3% |
| Hungarians | 9.6 /100 | #221 | Tragic 6.3% |
| German Russians | 9.4 /100 | #222 | Tragic 6.3% |
| Immigrants | Honduras | 7.6 /100 | #223 | Tragic 6.3% |
| Liberians | 7.1 /100 | #224 | Tragic 6.3% |
| Hondurans | 6.3 /100 | #225 | Tragic 6.3% |
| Slavs | 5.1 /100 | #226 | Tragic 6.4% |
| Cubans | 4.0 /100 | #227 | Tragic 6.4% |