Immigrants from Saudi Arabia vs Finnish Ambulatory Disability
COMPARE
Immigrants from Saudi Arabia
Finnish
Ambulatory Disability
Ambulatory Disability Comparison
Immigrants from Saudi Arabia
Finns
5.4%
AMBULATORY DISABILITY
100.0/ 100
METRIC RATING
24th/ 347
METRIC RANK
6.2%
AMBULATORY DISABILITY
17.2/ 100
METRIC RATING
206th/ 347
METRIC RANK
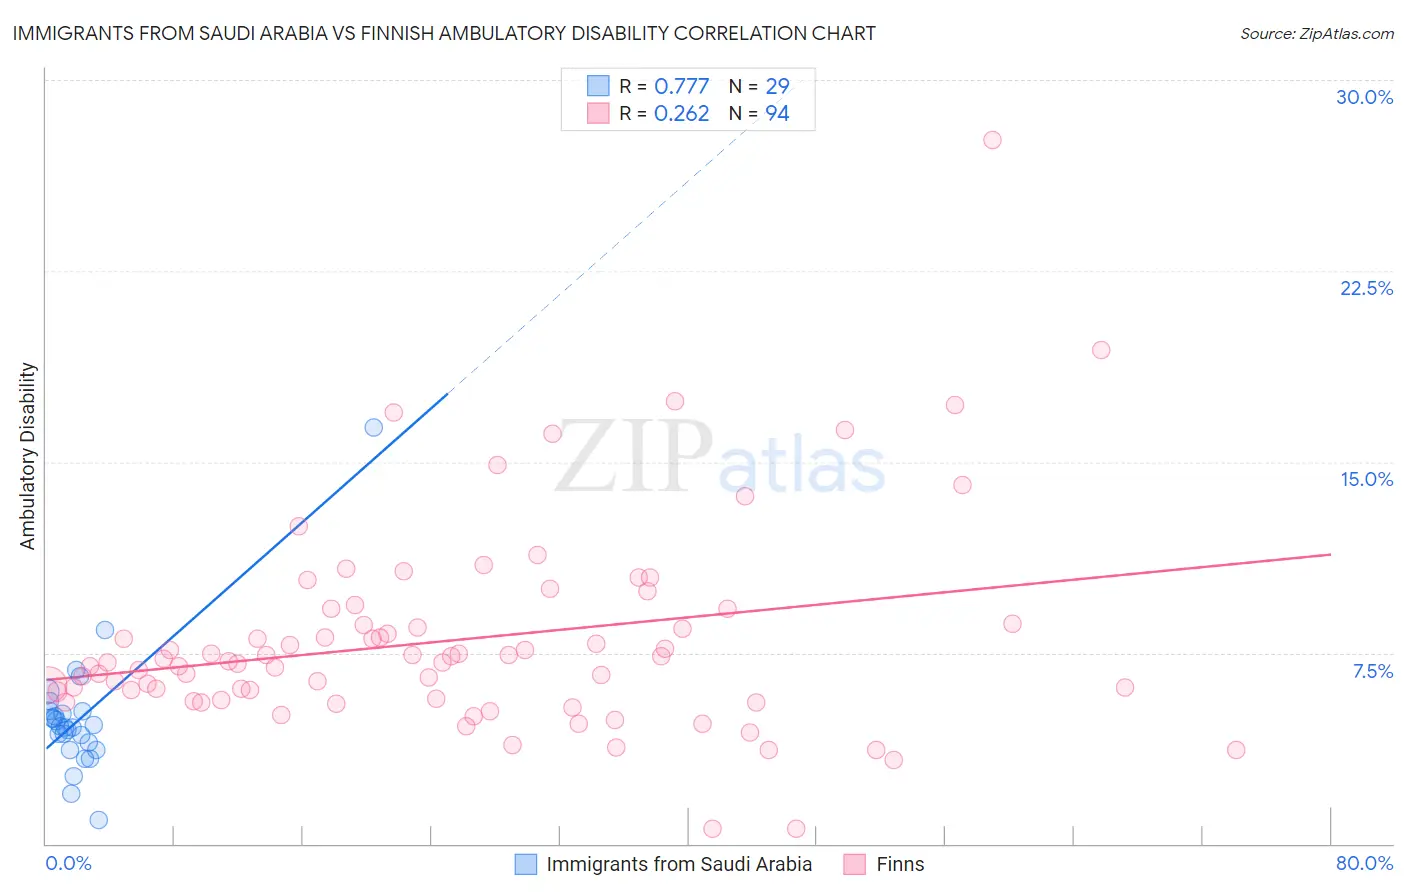
Immigrants from Saudi Arabia vs Finnish Ambulatory Disability Correlation Chart
The statistical analysis conducted on geographies consisting of 164,275,583 people shows a strong positive correlation between the proportion of Immigrants from Saudi Arabia and percentage of population with ambulatory disability in the United States with a correlation coefficient (R) of 0.777 and weighted average of 5.4%. Similarly, the statistical analysis conducted on geographies consisting of 404,562,886 people shows a weak positive correlation between the proportion of Finns and percentage of population with ambulatory disability in the United States with a correlation coefficient (R) of 0.262 and weighted average of 6.2%, a difference of 15.9%.
Ambulatory Disability Correlation Summary
| Measurement | Immigrants from Saudi Arabia | Finnish |
| Minimum | 0.94% | 0.58% |
| Maximum | 16.3% | 27.6% |
| Range | 15.4% | 27.1% |
| Mean | 5.0% | 8.0% |
| Median | 4.6% | 7.2% |
| Interquartile 25% (IQ1) | 3.8% | 5.7% |
| Interquartile 75% (IQ3) | 5.2% | 8.6% |
| Interquartile Range (IQR) | 1.4% | 2.9% |
| Standard Deviation (Sample) | 2.6% | 4.0% |
| Standard Deviation (Population) | 2.6% | 4.0% |
Similar Demographics by Ambulatory Disability
Demographics Similar to Immigrants from Saudi Arabia by Ambulatory Disability
In terms of ambulatory disability, the demographic groups most similar to Immigrants from Saudi Arabia are Zimbabwean (5.4%, a difference of 0.080%), Tongan (5.4%, a difference of 0.090%), Immigrants from Nepal (5.4%, a difference of 0.11%), Immigrants from Israel (5.4%, a difference of 0.13%), and Asian (5.4%, a difference of 0.27%).
| Demographics | Rating | Rank | Ambulatory Disability |
| Immigrants | Ethiopia | 100.0 /100 | #17 | Exceptional 5.4% |
| Immigrants | Sri Lanka | 100.0 /100 | #18 | Exceptional 5.4% |
| Indians (Asian) | 100.0 /100 | #19 | Exceptional 5.4% |
| Ethiopians | 100.0 /100 | #20 | Exceptional 5.4% |
| Immigrants | Kuwait | 100.0 /100 | #21 | Exceptional 5.4% |
| Immigrants | Israel | 100.0 /100 | #22 | Exceptional 5.4% |
| Tongans | 100.0 /100 | #23 | Exceptional 5.4% |
| Immigrants | Saudi Arabia | 100.0 /100 | #24 | Exceptional 5.4% |
| Zimbabweans | 100.0 /100 | #25 | Exceptional 5.4% |
| Immigrants | Nepal | 100.0 /100 | #26 | Exceptional 5.4% |
| Asians | 100.0 /100 | #27 | Exceptional 5.4% |
| Cambodians | 100.0 /100 | #28 | Exceptional 5.4% |
| Immigrants | Iran | 100.0 /100 | #29 | Exceptional 5.4% |
| Immigrants | Turkey | 100.0 /100 | #30 | Exceptional 5.4% |
| Immigrants | Venezuela | 100.0 /100 | #31 | Exceptional 5.4% |
Demographics Similar to Finns by Ambulatory Disability
In terms of ambulatory disability, the demographic groups most similar to Finns are Slovene (6.2%, a difference of 0.070%), Immigrants from Congo (6.2%, a difference of 0.090%), Immigrants from Ukraine (6.2%, a difference of 0.10%), Alsatian (6.3%, a difference of 0.21%), and Albanian (6.2%, a difference of 0.22%).
| Demographics | Rating | Rank | Ambulatory Disability |
| Italians | 22.6 /100 | #199 | Fair 6.2% |
| Immigrants | Cambodia | 21.5 /100 | #200 | Fair 6.2% |
| Immigrants | Central America | 20.1 /100 | #201 | Fair 6.2% |
| Albanians | 19.7 /100 | #202 | Poor 6.2% |
| Immigrants | Ukraine | 18.4 /100 | #203 | Poor 6.2% |
| Immigrants | Congo | 18.2 /100 | #204 | Poor 6.2% |
| Slovenes | 18.0 /100 | #205 | Poor 6.2% |
| Finns | 17.2 /100 | #206 | Poor 6.2% |
| Alsatians | 15.1 /100 | #207 | Poor 6.3% |
| Bangladeshis | 14.2 /100 | #208 | Poor 6.3% |
| Immigrants | Iraq | 14.0 /100 | #209 | Poor 6.3% |
| Immigrants | Laos | 13.2 /100 | #210 | Poor 6.3% |
| Samoans | 12.1 /100 | #211 | Poor 6.3% |
| Mexican American Indians | 12.0 /100 | #212 | Poor 6.3% |
| Japanese | 12.0 /100 | #213 | Poor 6.3% |