Asian vs Cape Verdean Disability
COMPARE
Asian
Cape Verdean
Disability
Disability Comparison
Asians
Cape Verdeans
10.4%
DISABILITY
100.0/ 100
METRIC RATING
21st/ 347
METRIC RANK
13.5%
DISABILITY
0.0/ 100
METRIC RATING
306th/ 347
METRIC RANK
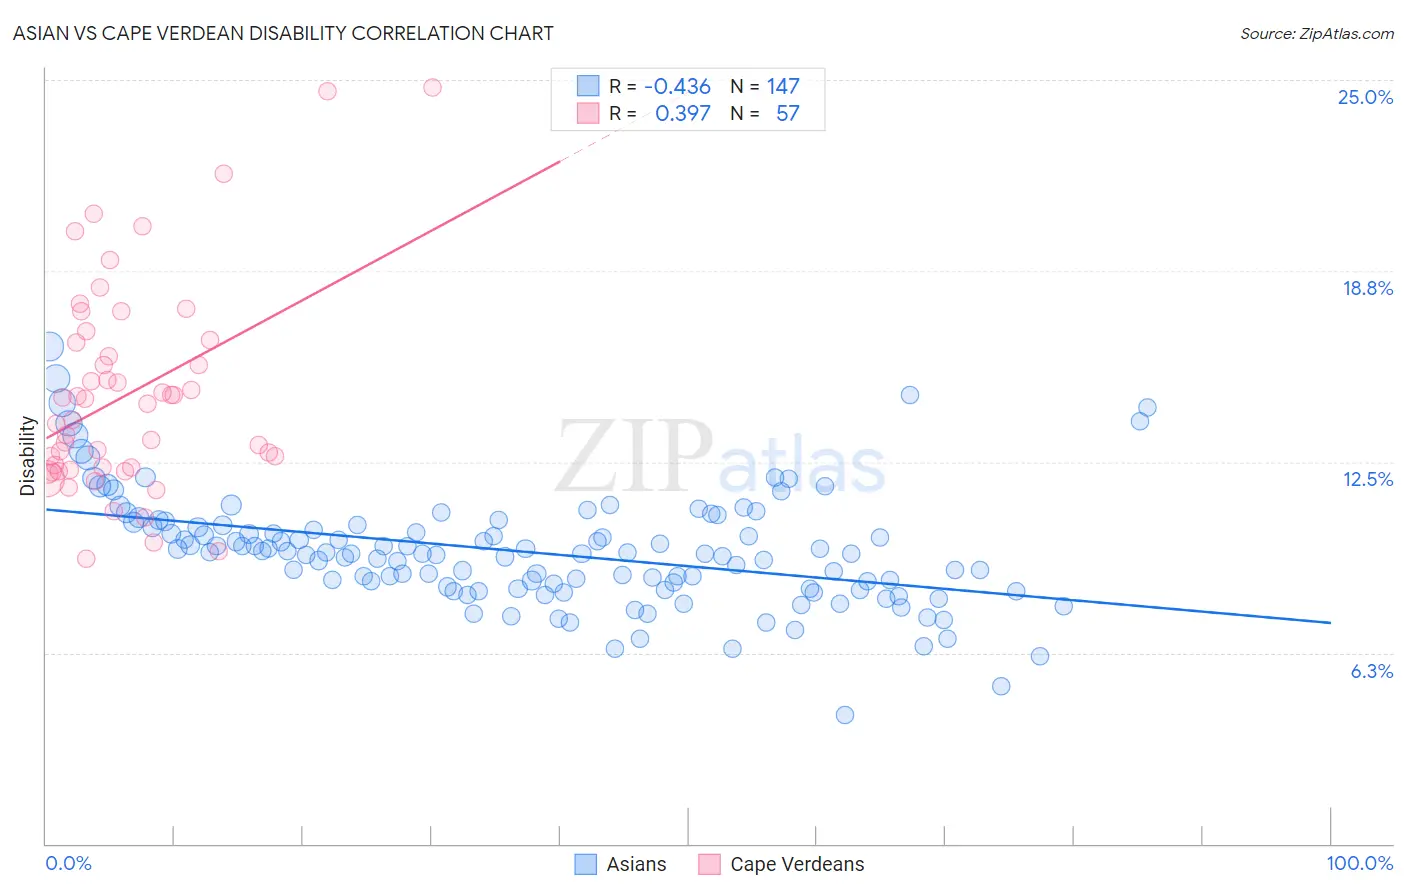
Asian vs Cape Verdean Disability Correlation Chart
The statistical analysis conducted on geographies consisting of 550,807,105 people shows a moderate negative correlation between the proportion of Asians and percentage of population with a disability in the United States with a correlation coefficient (R) of -0.436 and weighted average of 10.4%. Similarly, the statistical analysis conducted on geographies consisting of 107,573,874 people shows a mild positive correlation between the proportion of Cape Verdeans and percentage of population with a disability in the United States with a correlation coefficient (R) of 0.397 and weighted average of 13.5%, a difference of 29.3%.
Disability Correlation Summary
| Measurement | Asian | Cape Verdean |
| Minimum | 4.2% | 9.3% |
| Maximum | 16.3% | 24.7% |
| Range | 12.0% | 15.4% |
| Mean | 9.6% | 14.7% |
| Median | 9.5% | 14.4% |
| Interquartile 25% (IQ1) | 8.4% | 12.3% |
| Interquartile 75% (IQ3) | 10.4% | 16.5% |
| Interquartile Range (IQR) | 2.1% | 4.2% |
| Standard Deviation (Sample) | 1.9% | 3.4% |
| Standard Deviation (Population) | 1.9% | 3.4% |
Similar Demographics by Disability
Demographics Similar to Asians by Disability
In terms of disability, the demographic groups most similar to Asians are Immigrants from Venezuela (10.4%, a difference of 0.030%), Immigrants from Sri Lanka (10.5%, a difference of 0.10%), Burmese (10.4%, a difference of 0.72%), Immigrants from Pakistan (10.4%, a difference of 0.72%), and Immigrants from Asia (10.5%, a difference of 0.80%).
| Demographics | Rating | Rank | Disability |
| Immigrants | Korea | 100.0 /100 | #14 | Exceptional 10.2% |
| Okinawans | 100.0 /100 | #15 | Exceptional 10.3% |
| Indians (Asian) | 100.0 /100 | #16 | Exceptional 10.3% |
| Immigrants | Iran | 100.0 /100 | #17 | Exceptional 10.3% |
| Burmese | 100.0 /100 | #18 | Exceptional 10.4% |
| Immigrants | Pakistan | 100.0 /100 | #19 | Exceptional 10.4% |
| Immigrants | Venezuela | 100.0 /100 | #20 | Exceptional 10.4% |
| Asians | 100.0 /100 | #21 | Exceptional 10.4% |
| Immigrants | Sri Lanka | 100.0 /100 | #22 | Exceptional 10.5% |
| Immigrants | Asia | 100.0 /100 | #23 | Exceptional 10.5% |
| Venezuelans | 100.0 /100 | #24 | Exceptional 10.5% |
| Immigrants | Malaysia | 100.0 /100 | #25 | Exceptional 10.6% |
| Argentineans | 100.0 /100 | #26 | Exceptional 10.6% |
| Cypriots | 100.0 /100 | #27 | Exceptional 10.6% |
| Egyptians | 100.0 /100 | #28 | Exceptional 10.6% |
Demographics Similar to Cape Verdeans by Disability
In terms of disability, the demographic groups most similar to Cape Verdeans are Shoshone (13.5%, a difference of 0.050%), French American Indian (13.5%, a difference of 0.14%), Tlingit-Haida (13.5%, a difference of 0.23%), French Canadian (13.4%, a difference of 0.61%), and Blackfeet (13.6%, a difference of 0.76%).
| Demographics | Rating | Rank | Disability |
| French | 0.0 /100 | #299 | Tragic 13.2% |
| Pennsylvania Germans | 0.0 /100 | #300 | Tragic 13.2% |
| Immigrants | Micronesia | 0.0 /100 | #301 | Tragic 13.2% |
| Arapaho | 0.0 /100 | #302 | Tragic 13.2% |
| Scotch-Irish | 0.0 /100 | #303 | Tragic 13.3% |
| Yakama | 0.0 /100 | #304 | Tragic 13.4% |
| French Canadians | 0.0 /100 | #305 | Tragic 13.4% |
| Cape Verdeans | 0.0 /100 | #306 | Tragic 13.5% |
| Shoshone | 0.0 /100 | #307 | Tragic 13.5% |
| French American Indians | 0.0 /100 | #308 | Tragic 13.5% |
| Tlingit-Haida | 0.0 /100 | #309 | Tragic 13.5% |
| Blackfeet | 0.0 /100 | #310 | Tragic 13.6% |
| Delaware | 0.0 /100 | #311 | Tragic 13.6% |
| Spanish Americans | 0.0 /100 | #312 | Tragic 13.6% |
| Cree | 0.0 /100 | #313 | Tragic 13.7% |