British West Indian vs Cape Verdean Disability
COMPARE
British West Indian
Cape Verdean
Disability
Disability Comparison
British West Indians
Cape Verdeans
12.0%
DISABILITY
11.5/ 100
METRIC RATING
203rd/ 347
METRIC RANK
13.5%
DISABILITY
0.0/ 100
METRIC RATING
306th/ 347
METRIC RANK
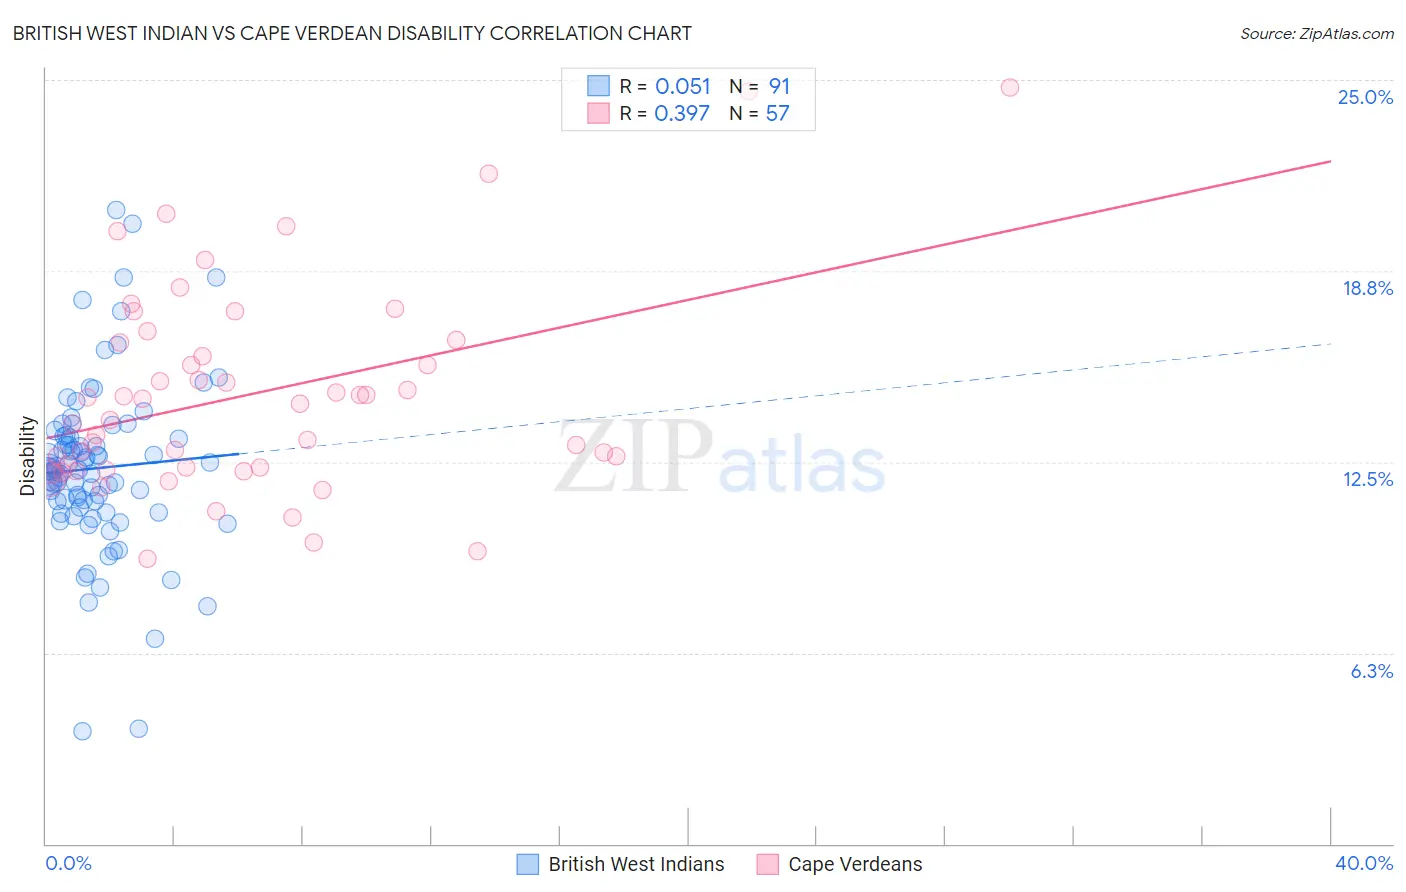
British West Indian vs Cape Verdean Disability Correlation Chart
The statistical analysis conducted on geographies consisting of 152,680,197 people shows a slight positive correlation between the proportion of British West Indians and percentage of population with a disability in the United States with a correlation coefficient (R) of 0.051 and weighted average of 12.0%. Similarly, the statistical analysis conducted on geographies consisting of 107,573,874 people shows a mild positive correlation between the proportion of Cape Verdeans and percentage of population with a disability in the United States with a correlation coefficient (R) of 0.397 and weighted average of 13.5%, a difference of 12.9%.
Disability Correlation Summary
| Measurement | British West Indian | Cape Verdean |
| Minimum | 3.7% | 9.3% |
| Maximum | 20.8% | 24.7% |
| Range | 17.1% | 15.4% |
| Mean | 12.3% | 14.7% |
| Median | 12.2% | 14.4% |
| Interquartile 25% (IQ1) | 11.0% | 12.3% |
| Interquartile 75% (IQ3) | 13.3% | 16.5% |
| Interquartile Range (IQR) | 2.3% | 4.2% |
| Standard Deviation (Sample) | 2.8% | 3.4% |
| Standard Deviation (Population) | 2.8% | 3.4% |
Similar Demographics by Disability
Demographics Similar to British West Indians by Disability
In terms of disability, the demographic groups most similar to British West Indians are Mexican American Indian (12.0%, a difference of 0.0%), Immigrants from England (12.0%, a difference of 0.050%), Assyrian/Chaldean/Syriac (11.9%, a difference of 0.12%), Belizean (11.9%, a difference of 0.14%), and Immigrants from Western Europe (12.0%, a difference of 0.16%).
| Demographics | Rating | Rank | Disability |
| Serbians | 15.4 /100 | #196 | Poor 11.9% |
| Immigrants | Belize | 15.2 /100 | #197 | Poor 11.9% |
| Ukrainians | 14.7 /100 | #198 | Poor 11.9% |
| Immigrants | Panama | 14.6 /100 | #199 | Poor 11.9% |
| Belizeans | 12.8 /100 | #200 | Poor 11.9% |
| Assyrians/Chaldeans/Syriacs | 12.6 /100 | #201 | Poor 11.9% |
| Immigrants | England | 12.0 /100 | #202 | Poor 12.0% |
| British West Indians | 11.5 /100 | #203 | Poor 12.0% |
| Mexican American Indians | 11.4 /100 | #204 | Poor 12.0% |
| Immigrants | Western Europe | 10.1 /100 | #205 | Poor 12.0% |
| Immigrants | Senegal | 9.4 /100 | #206 | Tragic 12.0% |
| Immigrants | Thailand | 9.3 /100 | #207 | Tragic 12.0% |
| Immigrants | Caribbean | 9.1 /100 | #208 | Tragic 12.0% |
| Danes | 8.7 /100 | #209 | Tragic 12.0% |
| Czechs | 7.9 /100 | #210 | Tragic 12.0% |
Demographics Similar to Cape Verdeans by Disability
In terms of disability, the demographic groups most similar to Cape Verdeans are Shoshone (13.5%, a difference of 0.050%), French American Indian (13.5%, a difference of 0.14%), Tlingit-Haida (13.5%, a difference of 0.23%), French Canadian (13.4%, a difference of 0.61%), and Blackfeet (13.6%, a difference of 0.76%).
| Demographics | Rating | Rank | Disability |
| French | 0.0 /100 | #299 | Tragic 13.2% |
| Pennsylvania Germans | 0.0 /100 | #300 | Tragic 13.2% |
| Immigrants | Micronesia | 0.0 /100 | #301 | Tragic 13.2% |
| Arapaho | 0.0 /100 | #302 | Tragic 13.2% |
| Scotch-Irish | 0.0 /100 | #303 | Tragic 13.3% |
| Yakama | 0.0 /100 | #304 | Tragic 13.4% |
| French Canadians | 0.0 /100 | #305 | Tragic 13.4% |
| Cape Verdeans | 0.0 /100 | #306 | Tragic 13.5% |
| Shoshone | 0.0 /100 | #307 | Tragic 13.5% |
| French American Indians | 0.0 /100 | #308 | Tragic 13.5% |
| Tlingit-Haida | 0.0 /100 | #309 | Tragic 13.5% |
| Blackfeet | 0.0 /100 | #310 | Tragic 13.6% |
| Delaware | 0.0 /100 | #311 | Tragic 13.6% |
| Spanish Americans | 0.0 /100 | #312 | Tragic 13.6% |
| Cree | 0.0 /100 | #313 | Tragic 13.7% |