Creek vs Yakama Hearing Disability
COMPARE
Creek
Yakama
Hearing Disability
Hearing Disability Comparison
Creek
Yakama
4.4%
HEARING DISABILITY
0.0/ 100
METRIC RATING
336th/ 347
METRIC RANK
3.9%
HEARING DISABILITY
0.0/ 100
METRIC RATING
314th/ 347
METRIC RANK
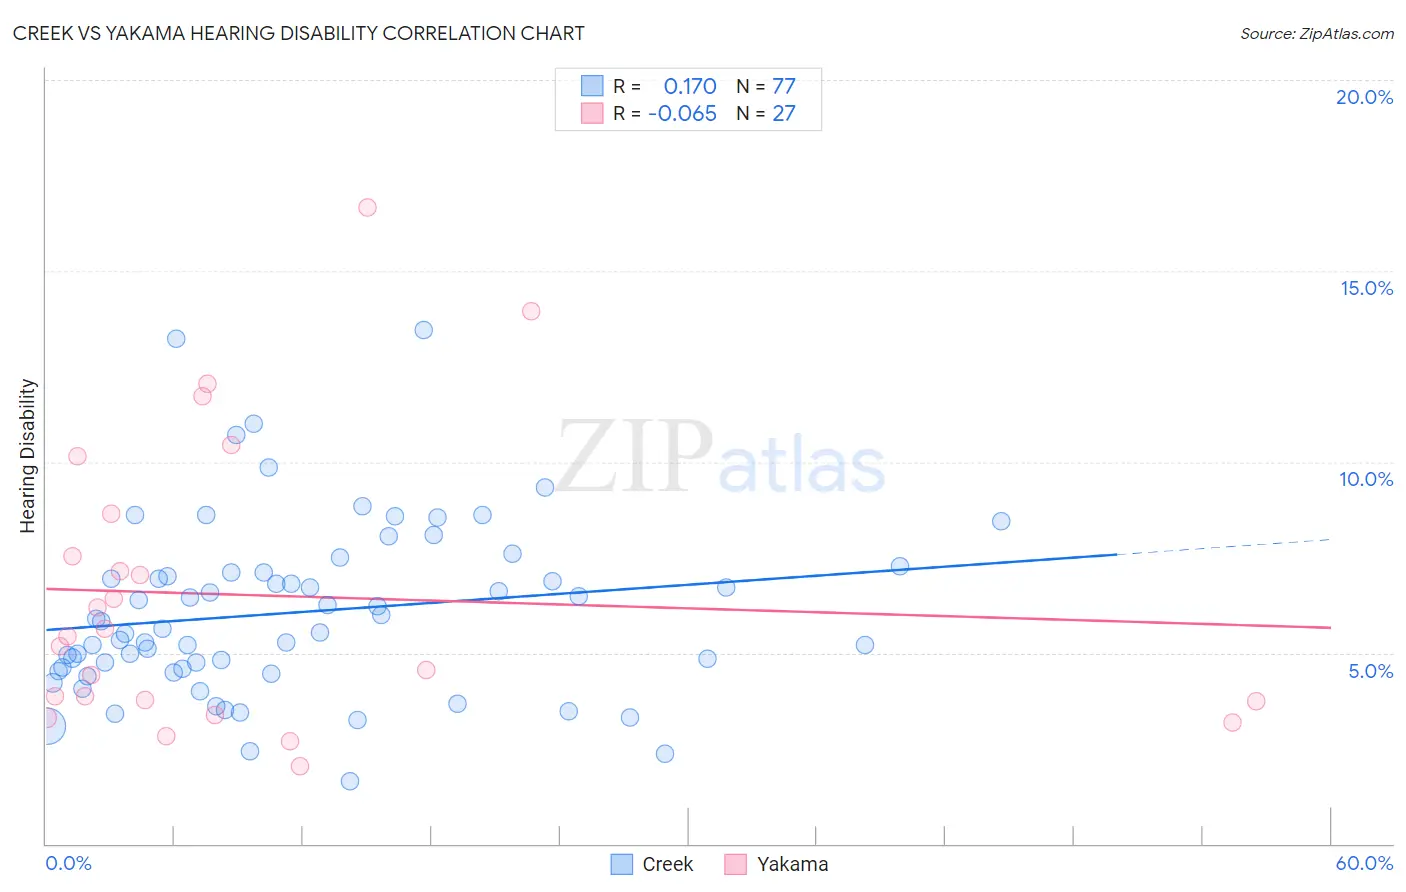
Creek vs Yakama Hearing Disability Correlation Chart
The statistical analysis conducted on geographies consisting of 178,433,224 people shows a poor positive correlation between the proportion of Creek and percentage of population with hearing disability in the United States with a correlation coefficient (R) of 0.170 and weighted average of 4.4%. Similarly, the statistical analysis conducted on geographies consisting of 19,917,800 people shows a slight negative correlation between the proportion of Yakama and percentage of population with hearing disability in the United States with a correlation coefficient (R) of -0.065 and weighted average of 3.9%, a difference of 10.6%.
Hearing Disability Correlation Summary
| Measurement | Creek | Yakama |
| Minimum | 1.6% | 2.0% |
| Maximum | 13.4% | 16.7% |
| Range | 11.8% | 14.6% |
| Mean | 6.1% | 6.5% |
| Median | 5.6% | 5.4% |
| Interquartile 25% (IQ1) | 4.6% | 3.7% |
| Interquartile 75% (IQ3) | 7.1% | 8.6% |
| Interquartile Range (IQR) | 2.5% | 4.9% |
| Standard Deviation (Sample) | 2.3% | 3.8% |
| Standard Deviation (Population) | 2.3% | 3.7% |
Similar Demographics by Hearing Disability
Demographics Similar to Creek by Hearing Disability
In terms of hearing disability, the demographic groups most similar to Creek are Kiowa (4.3%, a difference of 0.71%), Aleut (4.3%, a difference of 2.0%), Chickasaw (4.5%, a difference of 2.5%), Dutch West Indian (4.3%, a difference of 2.6%), and Alaska Native (4.5%, a difference of 2.7%).
| Demographics | Rating | Rank | Hearing Disability |
| Crow | 0.0 /100 | #329 | Tragic 4.2% |
| Natives/Alaskans | 0.0 /100 | #330 | Tragic 4.2% |
| Cherokee | 0.0 /100 | #331 | Tragic 4.2% |
| Houma | 0.0 /100 | #332 | Tragic 4.2% |
| Dutch West Indians | 0.0 /100 | #333 | Tragic 4.3% |
| Aleuts | 0.0 /100 | #334 | Tragic 4.3% |
| Kiowa | 0.0 /100 | #335 | Tragic 4.3% |
| Creek | 0.0 /100 | #336 | Tragic 4.4% |
| Chickasaw | 0.0 /100 | #337 | Tragic 4.5% |
| Alaska Natives | 0.0 /100 | #338 | Tragic 4.5% |
| Choctaw | 0.0 /100 | #339 | Tragic 4.5% |
| Pueblo | 0.0 /100 | #340 | Tragic 4.6% |
| Navajo | 0.0 /100 | #341 | Tragic 4.6% |
| Tsimshian | 0.0 /100 | #342 | Tragic 4.7% |
| Inupiat | 0.0 /100 | #343 | Tragic 4.7% |
Demographics Similar to Yakama by Hearing Disability
In terms of hearing disability, the demographic groups most similar to Yakama are Puget Sound Salish (3.9%, a difference of 0.010%), Hopi (3.9%, a difference of 0.17%), Spanish American (4.0%, a difference of 0.21%), Cajun (3.9%, a difference of 0.28%), and Comanche (4.0%, a difference of 0.34%).
| Demographics | Rating | Rank | Hearing Disability |
| French Canadians | 0.0 /100 | #307 | Tragic 3.8% |
| Ottawa | 0.0 /100 | #308 | Tragic 3.8% |
| Scotch-Irish | 0.0 /100 | #309 | Tragic 3.8% |
| Cree | 0.0 /100 | #310 | Tragic 3.8% |
| Americans | 0.0 /100 | #311 | Tragic 3.9% |
| Cajuns | 0.0 /100 | #312 | Tragic 3.9% |
| Hopi | 0.0 /100 | #313 | Tragic 3.9% |
| Yakama | 0.0 /100 | #314 | Tragic 3.9% |
| Puget Sound Salish | 0.0 /100 | #315 | Tragic 3.9% |
| Spanish Americans | 0.0 /100 | #316 | Tragic 4.0% |
| Comanche | 0.0 /100 | #317 | Tragic 4.0% |
| Cheyenne | 0.0 /100 | #318 | Tragic 4.0% |
| Chippewa | 0.0 /100 | #319 | Tragic 4.0% |
| Shoshone | 0.0 /100 | #320 | Tragic 4.0% |
| Paiute | 0.0 /100 | #321 | Tragic 4.1% |