Creek vs Immigrants from Hong Kong Hearing Disability
COMPARE
Creek
Immigrants from Hong Kong
Hearing Disability
Hearing Disability Comparison
Creek
Immigrants from Hong Kong
4.4%
HEARING DISABILITY
0.0/ 100
METRIC RATING
336th/ 347
METRIC RANK
2.7%
HEARING DISABILITY
99.2/ 100
METRIC RATING
51st/ 347
METRIC RANK
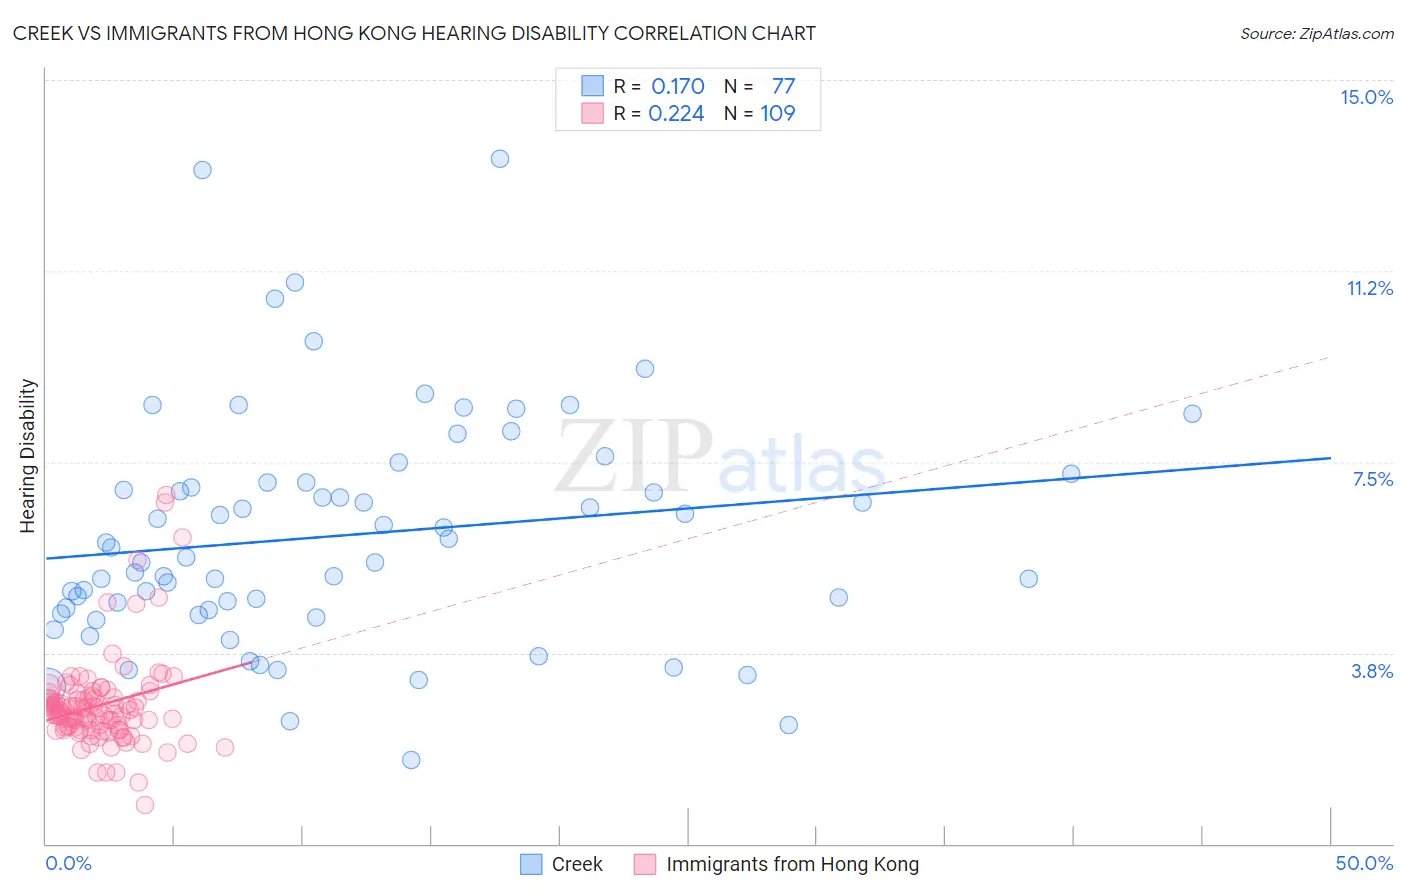
Creek vs Immigrants from Hong Kong Hearing Disability Correlation Chart
The statistical analysis conducted on geographies consisting of 178,433,224 people shows a poor positive correlation between the proportion of Creek and percentage of population with hearing disability in the United States with a correlation coefficient (R) of 0.170 and weighted average of 4.4%. Similarly, the statistical analysis conducted on geographies consisting of 253,945,747 people shows a weak positive correlation between the proportion of Immigrants from Hong Kong and percentage of population with hearing disability in the United States with a correlation coefficient (R) of 0.224 and weighted average of 2.7%, a difference of 64.2%.
Hearing Disability Correlation Summary
| Measurement | Creek | Immigrants from Hong Kong |
| Minimum | 1.6% | 0.77% |
| Maximum | 13.4% | 6.9% |
| Range | 11.8% | 6.1% |
| Mean | 6.1% | 2.7% |
| Median | 5.6% | 2.6% |
| Interquartile 25% (IQ1) | 4.6% | 2.3% |
| Interquartile 75% (IQ3) | 7.1% | 2.9% |
| Interquartile Range (IQR) | 2.5% | 0.63% |
| Standard Deviation (Sample) | 2.3% | 0.93% |
| Standard Deviation (Population) | 2.3% | 0.92% |
Similar Demographics by Hearing Disability
Demographics Similar to Creek by Hearing Disability
In terms of hearing disability, the demographic groups most similar to Creek are Kiowa (4.3%, a difference of 0.71%), Aleut (4.3%, a difference of 2.0%), Chickasaw (4.5%, a difference of 2.5%), Dutch West Indian (4.3%, a difference of 2.6%), and Alaska Native (4.5%, a difference of 2.7%).
| Demographics | Rating | Rank | Hearing Disability |
| Crow | 0.0 /100 | #329 | Tragic 4.2% |
| Natives/Alaskans | 0.0 /100 | #330 | Tragic 4.2% |
| Cherokee | 0.0 /100 | #331 | Tragic 4.2% |
| Houma | 0.0 /100 | #332 | Tragic 4.2% |
| Dutch West Indians | 0.0 /100 | #333 | Tragic 4.3% |
| Aleuts | 0.0 /100 | #334 | Tragic 4.3% |
| Kiowa | 0.0 /100 | #335 | Tragic 4.3% |
| Creek | 0.0 /100 | #336 | Tragic 4.4% |
| Chickasaw | 0.0 /100 | #337 | Tragic 4.5% |
| Alaska Natives | 0.0 /100 | #338 | Tragic 4.5% |
| Choctaw | 0.0 /100 | #339 | Tragic 4.5% |
| Pueblo | 0.0 /100 | #340 | Tragic 4.6% |
| Navajo | 0.0 /100 | #341 | Tragic 4.6% |
| Tsimshian | 0.0 /100 | #342 | Tragic 4.7% |
| Inupiat | 0.0 /100 | #343 | Tragic 4.7% |
Demographics Similar to Immigrants from Hong Kong by Hearing Disability
In terms of hearing disability, the demographic groups most similar to Immigrants from Hong Kong are Paraguayan (2.7%, a difference of 0.070%), Immigrants from South America (2.7%, a difference of 0.26%), Jamaican (2.7%, a difference of 0.36%), Immigrants from Singapore (2.6%, a difference of 0.38%), and Immigrants from Eastern Asia (2.7%, a difference of 0.42%).
| Demographics | Rating | Rank | Hearing Disability |
| Nigerians | 99.4 /100 | #44 | Exceptional 2.6% |
| Venezuelans | 99.4 /100 | #45 | Exceptional 2.6% |
| Immigrants | Dominica | 99.3 /100 | #46 | Exceptional 2.6% |
| Immigrants | Israel | 99.3 /100 | #47 | Exceptional 2.6% |
| Immigrants | Singapore | 99.3 /100 | #48 | Exceptional 2.6% |
| Immigrants | South America | 99.2 /100 | #49 | Exceptional 2.7% |
| Paraguayans | 99.2 /100 | #50 | Exceptional 2.7% |
| Immigrants | Hong Kong | 99.2 /100 | #51 | Exceptional 2.7% |
| Jamaicans | 99.0 /100 | #52 | Exceptional 2.7% |
| Immigrants | Eastern Asia | 99.0 /100 | #53 | Exceptional 2.7% |
| Ethiopians | 99.0 /100 | #54 | Exceptional 2.7% |
| Immigrants | Ethiopia | 99.0 /100 | #55 | Exceptional 2.7% |
| Immigrants | Nicaragua | 99.0 /100 | #56 | Exceptional 2.7% |
| South Americans | 99.0 /100 | #57 | Exceptional 2.7% |
| Immigrants | Peru | 98.6 /100 | #58 | Exceptional 2.7% |