Creek vs Immigrants from Northern Europe Hearing Disability
COMPARE
Creek
Immigrants from Northern Europe
Hearing Disability
Hearing Disability Comparison
Creek
Immigrants from Northern Europe
4.4%
HEARING DISABILITY
0.0/ 100
METRIC RATING
336th/ 347
METRIC RANK
3.2%
HEARING DISABILITY
7.0/ 100
METRIC RATING
218th/ 347
METRIC RANK
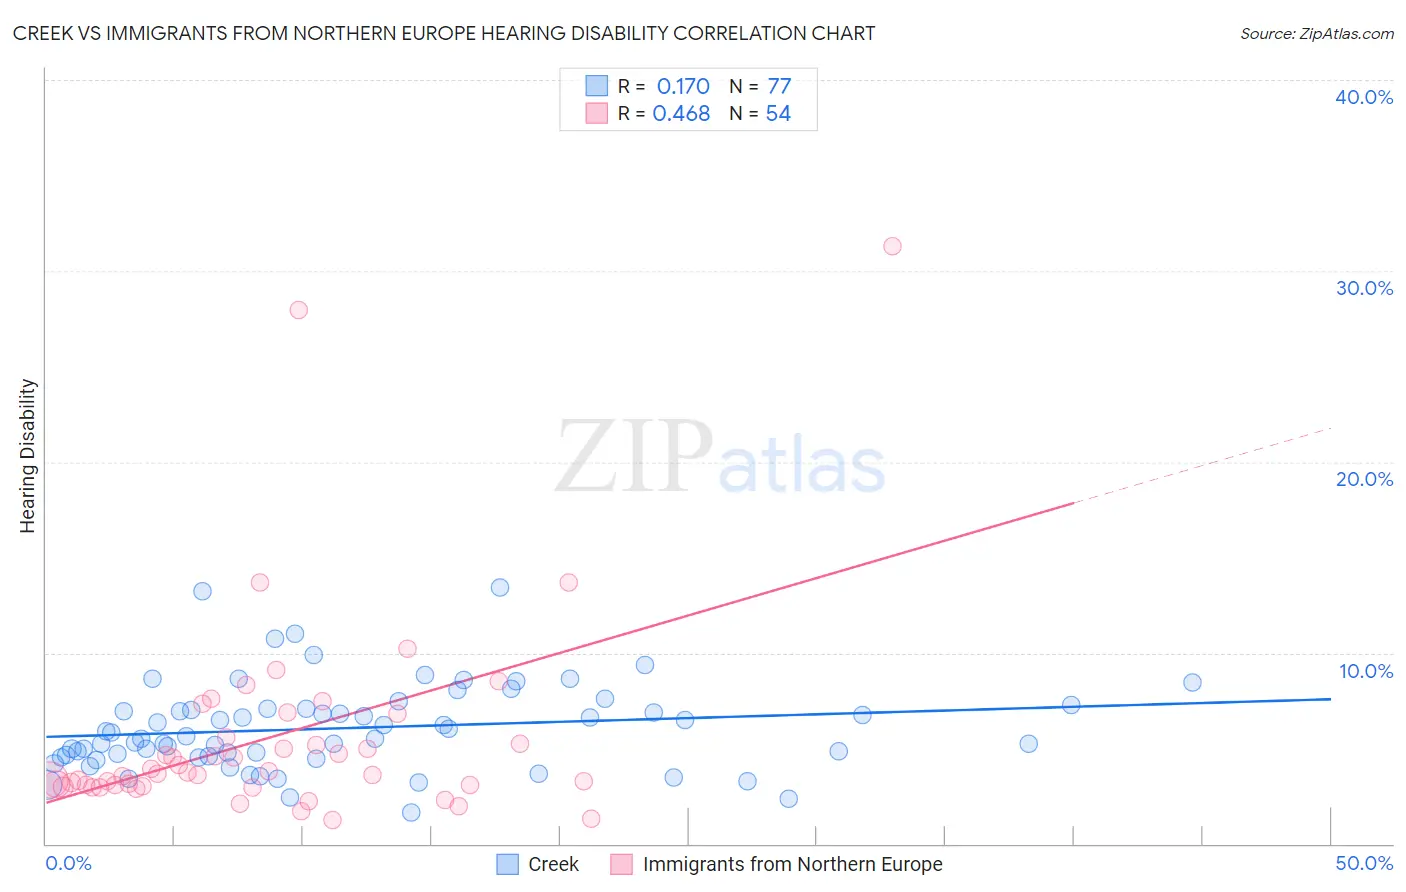
Creek vs Immigrants from Northern Europe Hearing Disability Correlation Chart
The statistical analysis conducted on geographies consisting of 178,433,224 people shows a poor positive correlation between the proportion of Creek and percentage of population with hearing disability in the United States with a correlation coefficient (R) of 0.170 and weighted average of 4.4%. Similarly, the statistical analysis conducted on geographies consisting of 477,037,225 people shows a moderate positive correlation between the proportion of Immigrants from Northern Europe and percentage of population with hearing disability in the United States with a correlation coefficient (R) of 0.468 and weighted average of 3.2%, a difference of 37.5%.
Hearing Disability Correlation Summary
| Measurement | Creek | Immigrants from Northern Europe |
| Minimum | 1.6% | 1.2% |
| Maximum | 13.4% | 31.3% |
| Range | 11.8% | 30.1% |
| Mean | 6.1% | 5.6% |
| Median | 5.6% | 3.7% |
| Interquartile 25% (IQ1) | 4.6% | 3.1% |
| Interquartile 75% (IQ3) | 7.1% | 5.5% |
| Interquartile Range (IQR) | 2.5% | 2.5% |
| Standard Deviation (Sample) | 2.3% | 5.5% |
| Standard Deviation (Population) | 2.3% | 5.4% |
Similar Demographics by Hearing Disability
Demographics Similar to Creek by Hearing Disability
In terms of hearing disability, the demographic groups most similar to Creek are Kiowa (4.3%, a difference of 0.71%), Aleut (4.3%, a difference of 2.0%), Chickasaw (4.5%, a difference of 2.5%), Dutch West Indian (4.3%, a difference of 2.6%), and Alaska Native (4.5%, a difference of 2.7%).
| Demographics | Rating | Rank | Hearing Disability |
| Crow | 0.0 /100 | #329 | Tragic 4.2% |
| Natives/Alaskans | 0.0 /100 | #330 | Tragic 4.2% |
| Cherokee | 0.0 /100 | #331 | Tragic 4.2% |
| Houma | 0.0 /100 | #332 | Tragic 4.2% |
| Dutch West Indians | 0.0 /100 | #333 | Tragic 4.3% |
| Aleuts | 0.0 /100 | #334 | Tragic 4.3% |
| Kiowa | 0.0 /100 | #335 | Tragic 4.3% |
| Creek | 0.0 /100 | #336 | Tragic 4.4% |
| Chickasaw | 0.0 /100 | #337 | Tragic 4.5% |
| Alaska Natives | 0.0 /100 | #338 | Tragic 4.5% |
| Choctaw | 0.0 /100 | #339 | Tragic 4.5% |
| Pueblo | 0.0 /100 | #340 | Tragic 4.6% |
| Navajo | 0.0 /100 | #341 | Tragic 4.6% |
| Tsimshian | 0.0 /100 | #342 | Tragic 4.7% |
| Inupiat | 0.0 /100 | #343 | Tragic 4.7% |
Demographics Similar to Immigrants from Northern Europe by Hearing Disability
In terms of hearing disability, the demographic groups most similar to Immigrants from Northern Europe are Russian (3.2%, a difference of 0.040%), New Zealander (3.2%, a difference of 0.060%), Immigrants from Norway (3.2%, a difference of 0.12%), Malaysian (3.2%, a difference of 0.12%), and Immigrants from Laos (3.2%, a difference of 0.12%).
| Demographics | Rating | Rank | Hearing Disability |
| Romanians | 12.1 /100 | #211 | Poor 3.1% |
| Pakistanis | 11.1 /100 | #212 | Poor 3.1% |
| Immigrants | Iraq | 10.5 /100 | #213 | Poor 3.1% |
| Australians | 8.1 /100 | #214 | Tragic 3.2% |
| Bangladeshis | 8.1 /100 | #215 | Tragic 3.2% |
| Immigrants | Norway | 7.3 /100 | #216 | Tragic 3.2% |
| Russians | 7.1 /100 | #217 | Tragic 3.2% |
| Immigrants | Northern Europe | 7.0 /100 | #218 | Tragic 3.2% |
| New Zealanders | 6.8 /100 | #219 | Tragic 3.2% |
| Malaysians | 6.6 /100 | #220 | Tragic 3.2% |
| Immigrants | Laos | 6.6 /100 | #221 | Tragic 3.2% |
| Immigrants | Oceania | 6.5 /100 | #222 | Tragic 3.2% |
| Mexicans | 5.6 /100 | #223 | Tragic 3.2% |
| Icelanders | 5.2 /100 | #224 | Tragic 3.2% |
| Latvians | 5.1 /100 | #225 | Tragic 3.2% |