Immigrants from Cameroon vs Immigrants from Hong Kong Hearing Disability
COMPARE
Immigrants from Cameroon
Immigrants from Hong Kong
Hearing Disability
Hearing Disability Comparison
Immigrants from Cameroon
Immigrants from Hong Kong
2.6%
HEARING DISABILITY
99.7/ 100
METRIC RATING
31st/ 347
METRIC RANK
2.7%
HEARING DISABILITY
99.2/ 100
METRIC RATING
51st/ 347
METRIC RANK
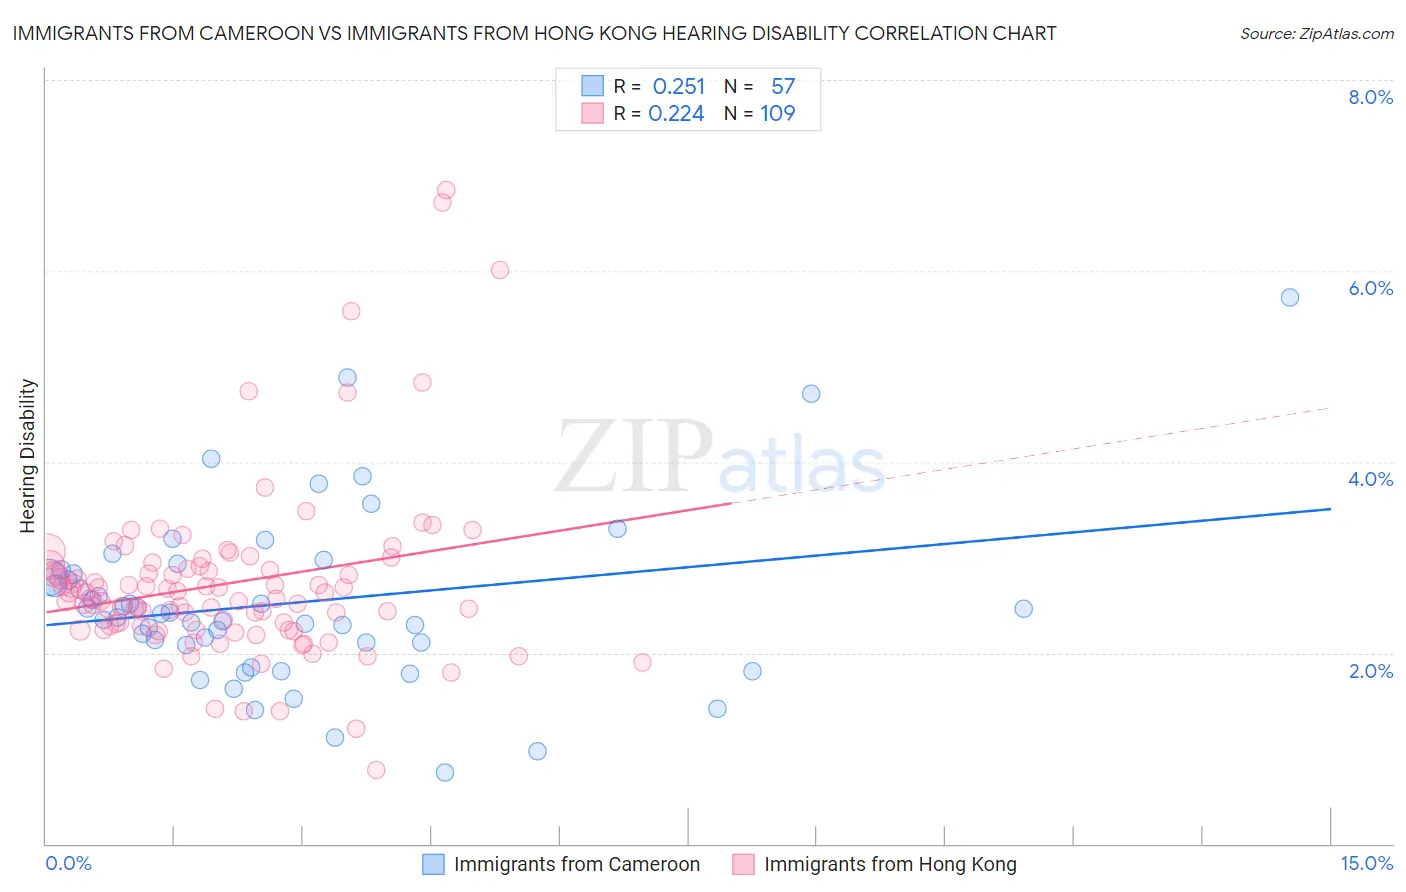
Immigrants from Cameroon vs Immigrants from Hong Kong Hearing Disability Correlation Chart
The statistical analysis conducted on geographies consisting of 130,730,708 people shows a weak positive correlation between the proportion of Immigrants from Cameroon and percentage of population with hearing disability in the United States with a correlation coefficient (R) of 0.251 and weighted average of 2.6%. Similarly, the statistical analysis conducted on geographies consisting of 253,945,747 people shows a weak positive correlation between the proportion of Immigrants from Hong Kong and percentage of population with hearing disability in the United States with a correlation coefficient (R) of 0.224 and weighted average of 2.7%, a difference of 2.5%.
Hearing Disability Correlation Summary
| Measurement | Immigrants from Cameroon | Immigrants from Hong Kong |
| Minimum | 0.75% | 0.77% |
| Maximum | 5.7% | 6.9% |
| Range | 5.0% | 6.1% |
| Mean | 2.5% | 2.7% |
| Median | 2.4% | 2.6% |
| Interquartile 25% (IQ1) | 2.1% | 2.3% |
| Interquartile 75% (IQ3) | 2.8% | 2.9% |
| Interquartile Range (IQR) | 0.75% | 0.63% |
| Standard Deviation (Sample) | 0.91% | 0.93% |
| Standard Deviation (Population) | 0.90% | 0.92% |
Demographics Similar to Immigrants from Cameroon and Immigrants from Hong Kong by Hearing Disability
In terms of hearing disability, the demographic groups most similar to Immigrants from Cameroon are Immigrants from Venezuela (2.6%, a difference of 0.14%), Filipino (2.6%, a difference of 0.40%), Immigrants from Pakistan (2.6%, a difference of 0.44%), Salvadoran (2.6%, a difference of 0.57%), and Okinawan (2.6%, a difference of 0.79%). Similarly, the demographic groups most similar to Immigrants from Hong Kong are Paraguayan (2.7%, a difference of 0.070%), Immigrants from South America (2.7%, a difference of 0.26%), Immigrants from Singapore (2.6%, a difference of 0.38%), Immigrants from Israel (2.6%, a difference of 0.45%), and Immigrants from Dominica (2.6%, a difference of 0.60%).
| Demographics | Rating | Rank | Hearing Disability |
| Immigrants | Cameroon | 99.7 /100 | #31 | Exceptional 2.6% |
| Immigrants | Venezuela | 99.7 /100 | #32 | Exceptional 2.6% |
| Filipinos | 99.6 /100 | #33 | Exceptional 2.6% |
| Immigrants | Pakistan | 99.6 /100 | #34 | Exceptional 2.6% |
| Salvadorans | 99.6 /100 | #35 | Exceptional 2.6% |
| Okinawans | 99.6 /100 | #36 | Exceptional 2.6% |
| Immigrants | Western Africa | 99.6 /100 | #37 | Exceptional 2.6% |
| Immigrants | Jamaica | 99.5 /100 | #38 | Exceptional 2.6% |
| Immigrants | China | 99.5 /100 | #39 | Exceptional 2.6% |
| Haitians | 99.5 /100 | #40 | Exceptional 2.6% |
| Immigrants | Taiwan | 99.4 /100 | #41 | Exceptional 2.6% |
| West Indians | 99.4 /100 | #42 | Exceptional 2.6% |
| Senegalese | 99.4 /100 | #43 | Exceptional 2.6% |
| Nigerians | 99.4 /100 | #44 | Exceptional 2.6% |
| Venezuelans | 99.4 /100 | #45 | Exceptional 2.6% |
| Immigrants | Dominica | 99.3 /100 | #46 | Exceptional 2.6% |
| Immigrants | Israel | 99.3 /100 | #47 | Exceptional 2.6% |
| Immigrants | Singapore | 99.3 /100 | #48 | Exceptional 2.6% |
| Immigrants | South America | 99.2 /100 | #49 | Exceptional 2.7% |
| Paraguayans | 99.2 /100 | #50 | Exceptional 2.7% |
| Immigrants | Hong Kong | 99.2 /100 | #51 | Exceptional 2.7% |